Market Data

March 29, 2019
SMU Currency Analysis: Dollar Weakens in Last Three Months
Written by Peter Wright
One of the primary drivers of currency change is interest rate differential between currency pairs. The March 20 announcement by the Federal Reserve will take some of the steam out of dollar appreciation that occurred last year.
On March 21, the Associated Press wrote, “The Federal Reserve left its key interest rate unchanged March 20 and projected no rate hikes this year, reflecting a dimmer view of the economy as growth weakens in the United States and abroad. In signaling no rate increases for 2019, the Fed’s policymakers reduced their forecast from two that were previously predicted in December. They now project one rate hike in 2020 and none in 2021. The Fed had raised rates four times last year and a total of nine times since 2015. The central bank’s theme Wednesday, in its statement and in a news conference by Chairman Jerome Powell, is that it will remain continually ‘patient’ about pursuing any further rate hikes.”
![]()
In the last three months, the dollar weakened against 11 of the 16 steel trading currencies that Steel Market Update tracks. At the one-month level the dollar broke even, weakening against eight and strengthening against the other eight. At the seven-day level the dollar weakened against 10 of the 16. Please see the end of this report for an explanation of data sources.
The last two months have been quiet in terms of publications by currency analysts. As we produce this update, we look for expert opinion to flesh out the values of the 16 steel trading nations that we track. But for the last two months the pickings have been slim.
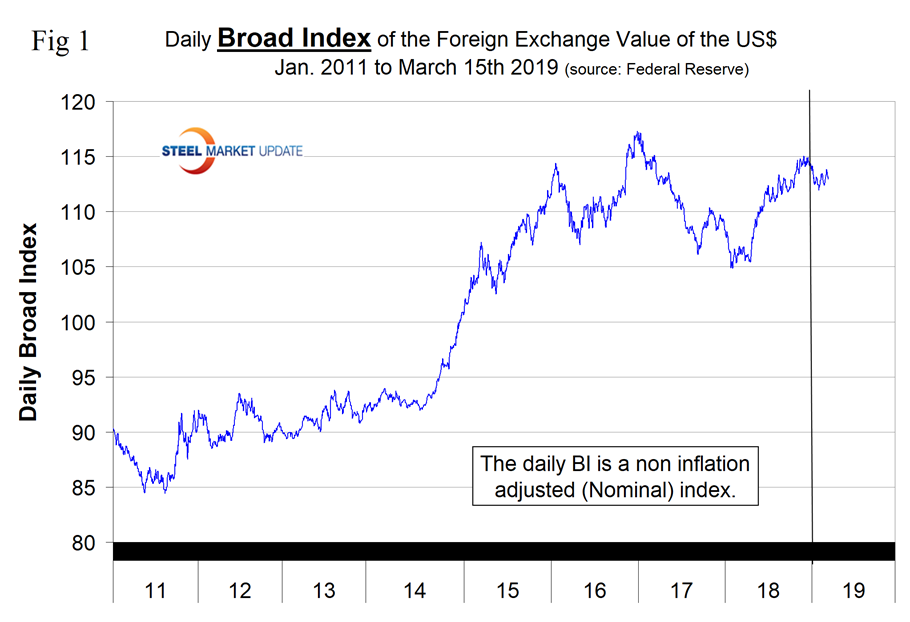
The Broad Index value of the U.S. dollar is reported several days in arrears by the Federal Reserve; the latest value published was for March 15. Figure 1 shows the index value since January 2011. On March 15, the index value was 112.96, down from 113.73 on Jan. 1. The index is based on January 2006=100. The dollar had a recent low of 84.48 on May 2, 2011, and a recent high of 117.31 on Dec. 28, 2016. One of the primary drivers of the value of the U.S. dollar is the differential between U.S. interest rates and those of our major trading partners. Another is the fear index that causes a flight to a safe haven (the U.S. dollar) when traders are nervous.
Each month, SMU publishes an update of Table 1, which shows the value of the U.S. dollar against the currencies of 16 major global steel and iron ore trading nations. The table shows the change in value in one year, three months, one month and seven days through Feb. 13. Currencies that weakened against the U.S. dollar are color coded in red. Green indicates currencies that strengthened against the U.S. dollar.
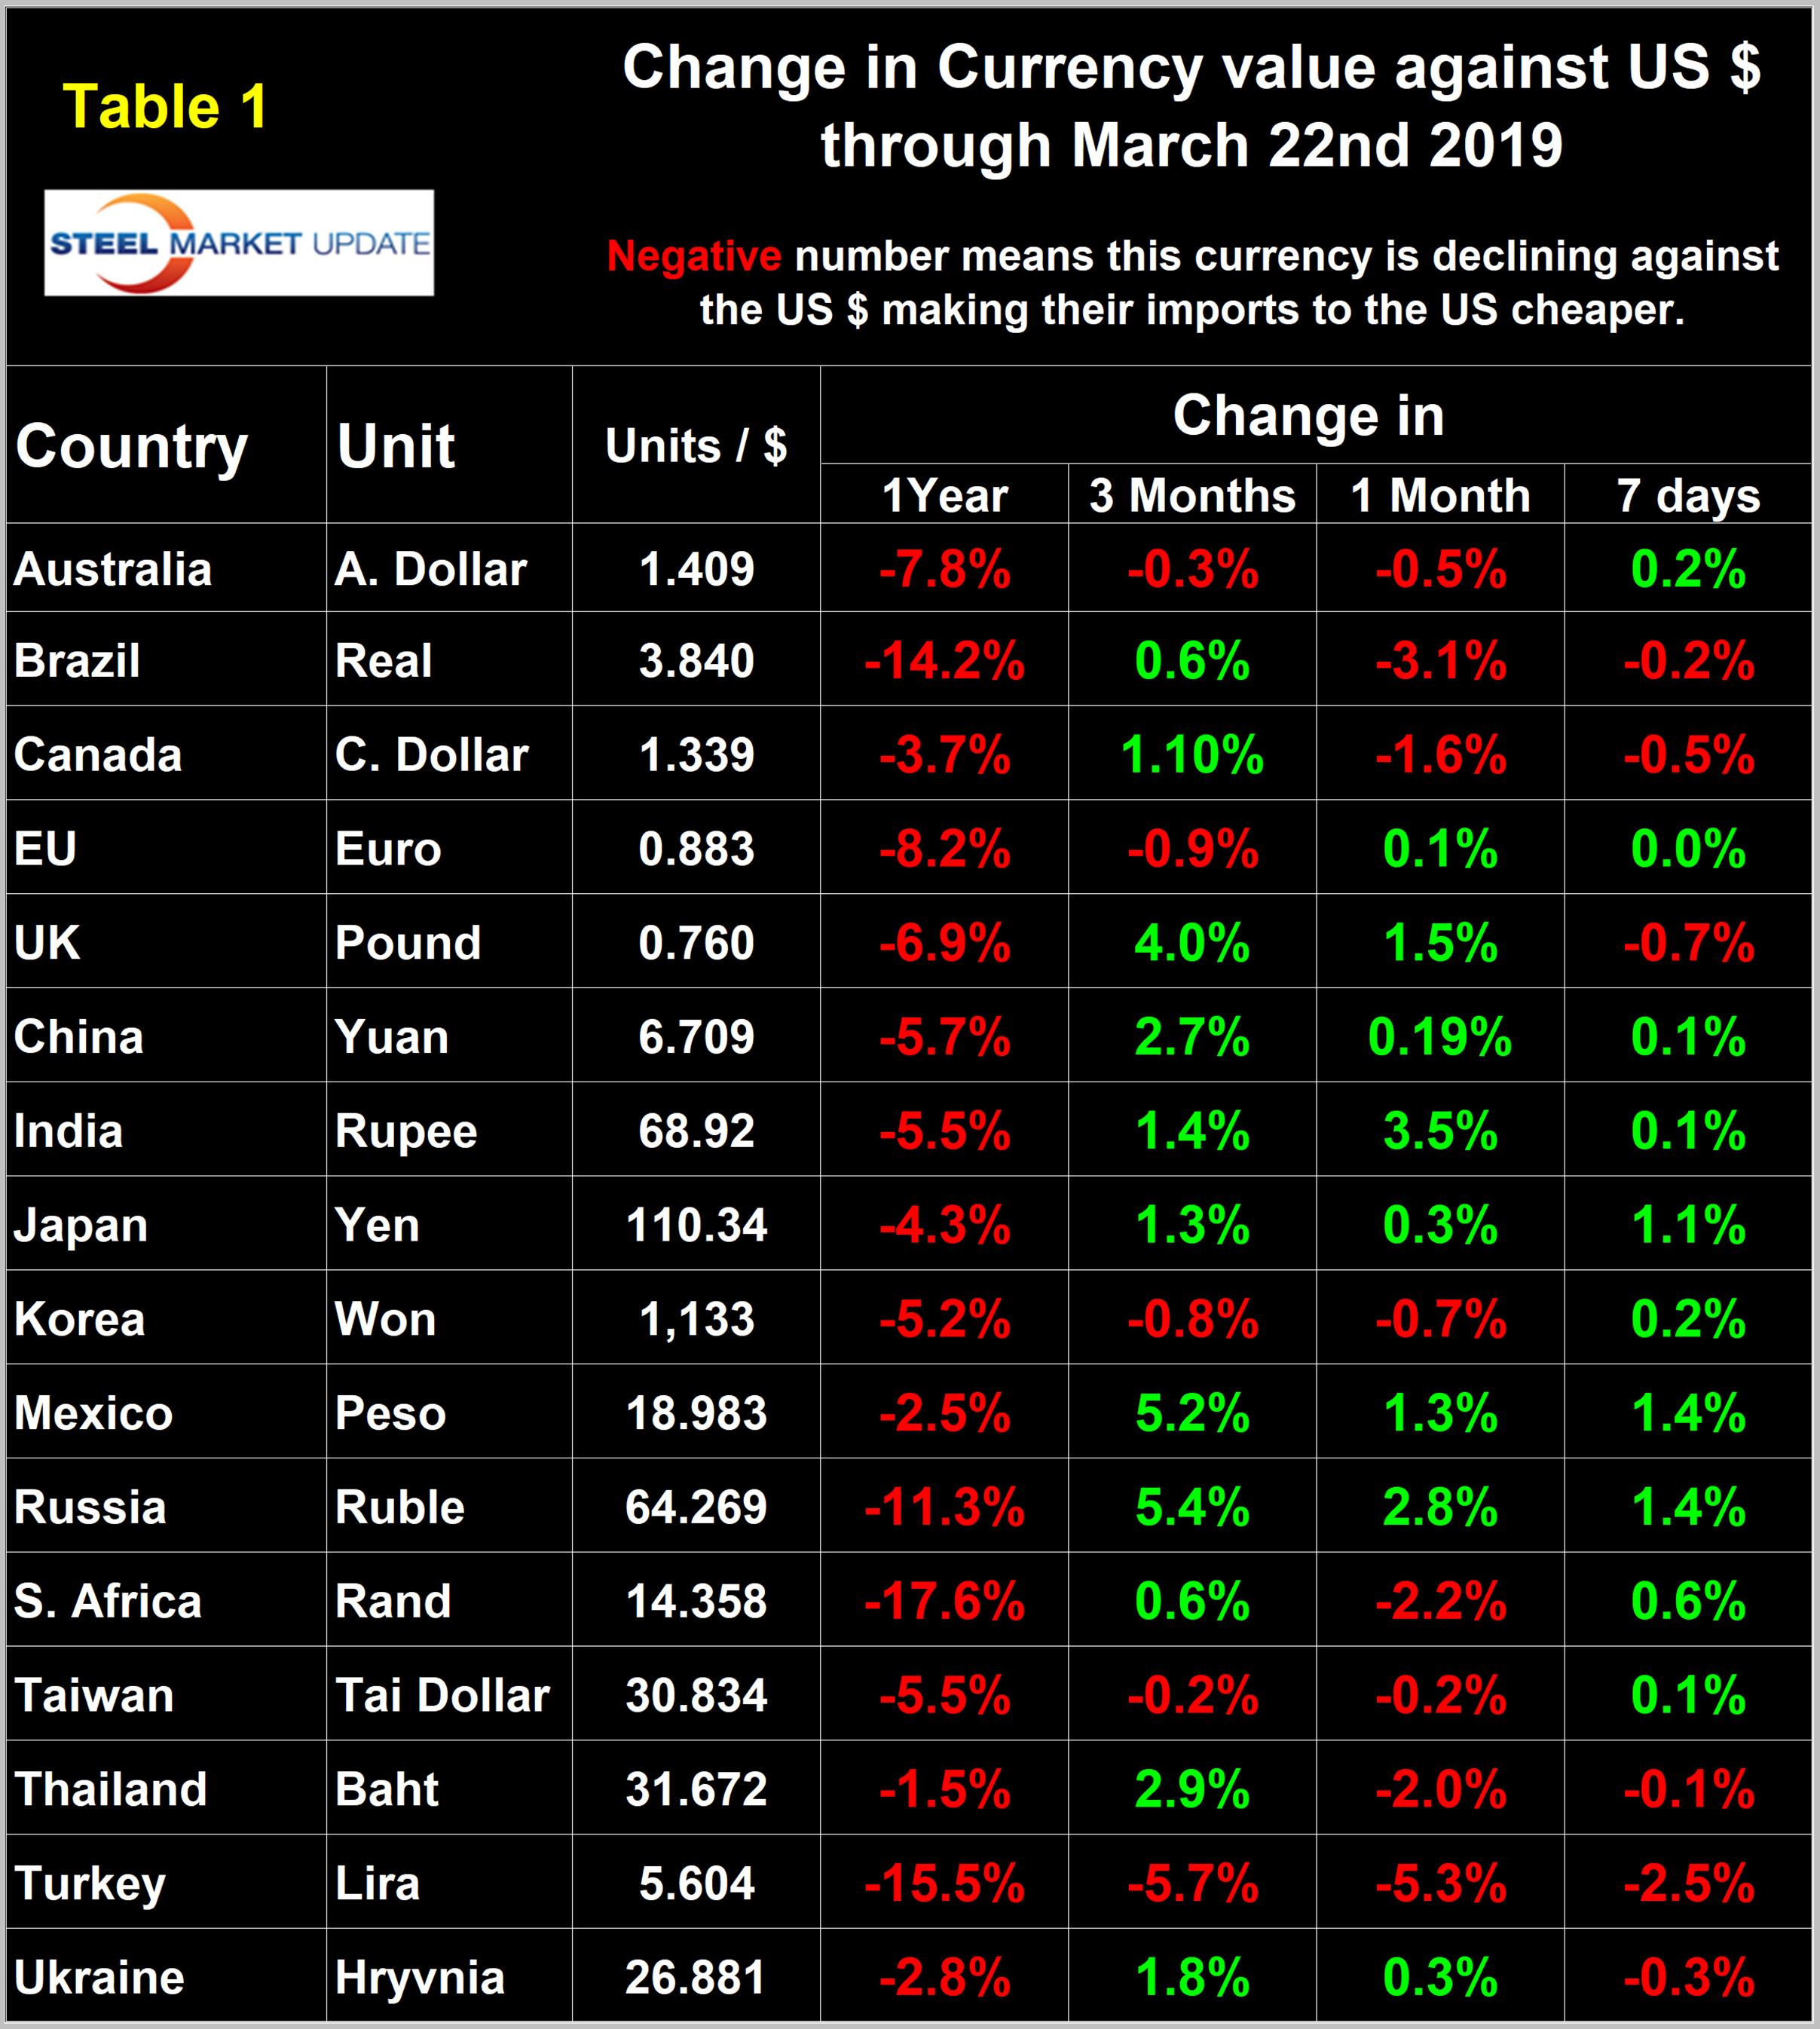
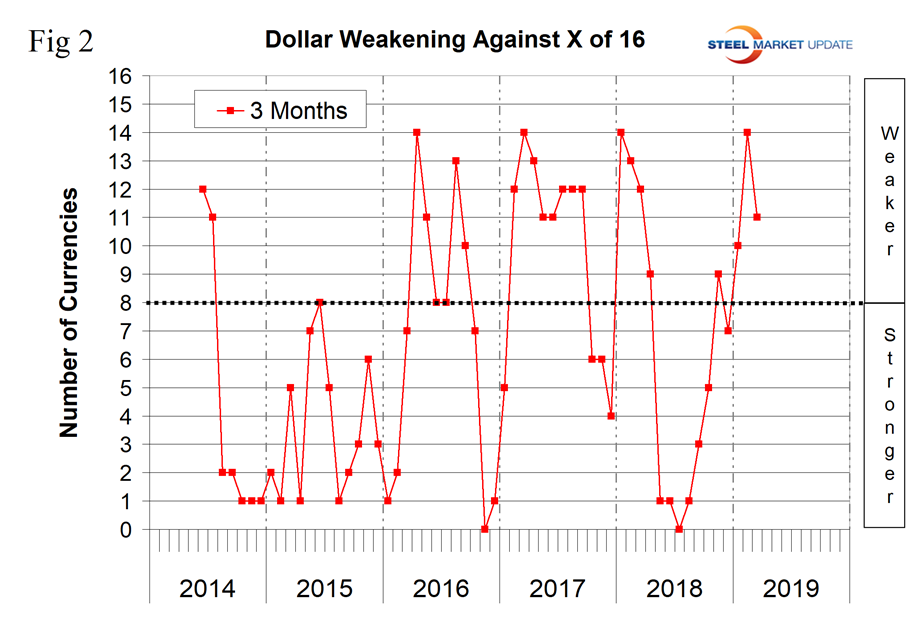
Figure 2 gives a longer-range perspective and shows the extreme gyrations that have occurred in the last three years at the three-month level. Through March 22, the dollar weakened against 11 of the 16 in three months and strengthened against the other five.
A falling dollar puts upward pressure on commodity prices that are greenback denominated. We regard strengthening of the U.S. dollar as negative and weakening as positive because of the effect on the trade balance of all commodities and on the total national trade deficit.
In each of these reports, we describe the history of several of the 16 steel and iron ore trading currencies listed in Table 1 and over a period of several months will give details on all of them. Charts for each of the 16 currencies are available through March 22 for any premium subscriber who requests them.
The Chinese Yuan
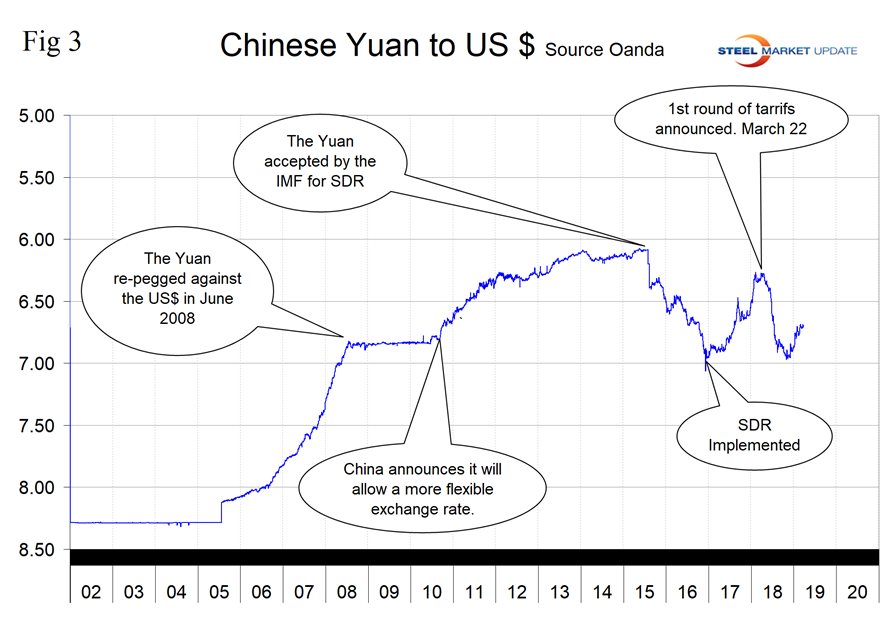
On March 22, it required 6.709 yuan to purchase one U.S. dollar. The yuan has strengthened by 2.7 percent in the last three months and by 0.2 percent in the last month (Figure 3).
The UK Pound
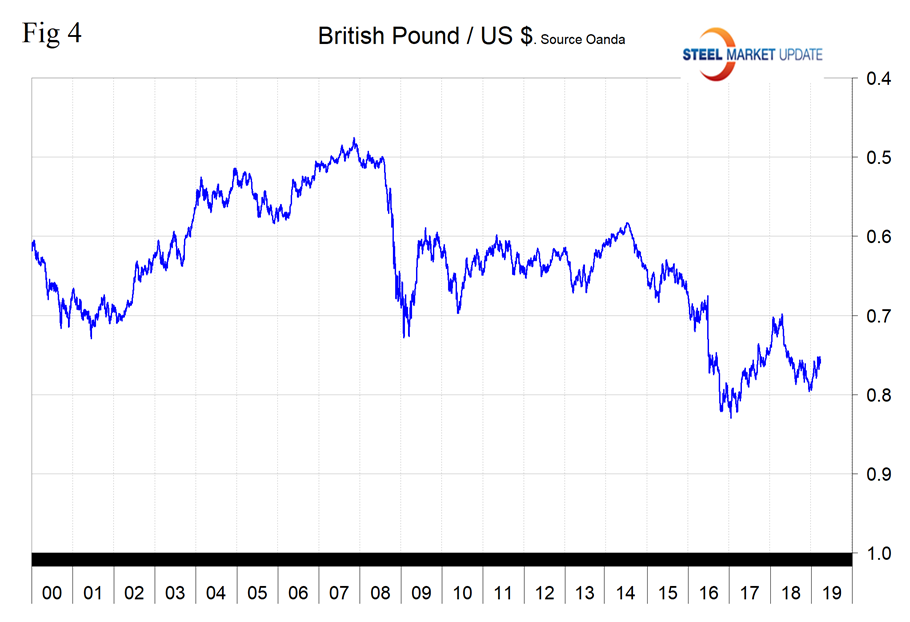
On March 22, it required 1.3166 U.S. dollars to buy one British pound. The pound has appreciated by 4.0 percent in the last three months and by 1.5 percent in the last month (Figure 4). Logically, because of the Brexit fiasco, the pound should be cratering. It looks as though the trading community is pricing in a more positive outcome than the news media is projecting.
The Russian Ruble
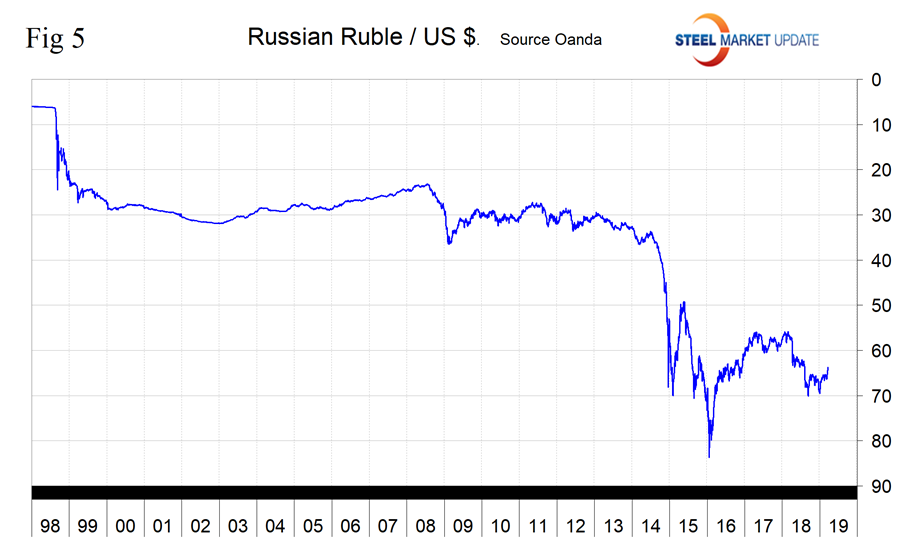
On March 22, it required 64.27 rubles to purchase one U.S. dollar. The ruble strengthened by 5.4 percent in the last three months and by 2.8 percent in the last month (Figure 5).
The Taiwanese Dollar
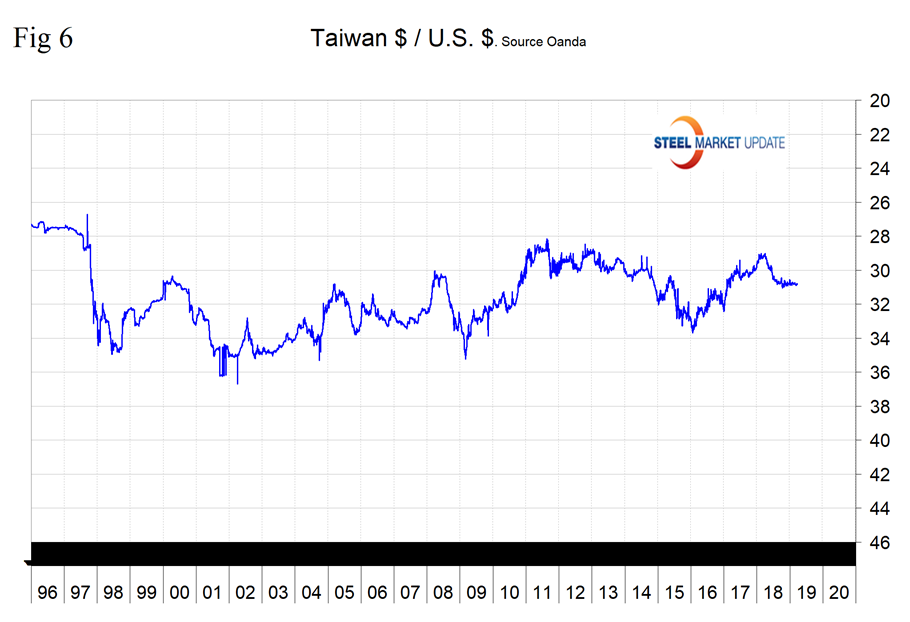
On March 22, it required 30.834 Taiwanese dollars to buy one U.S. dollar. The Taiwanese dollar had declined by 0.2 percent in the last three months (Figure 6).
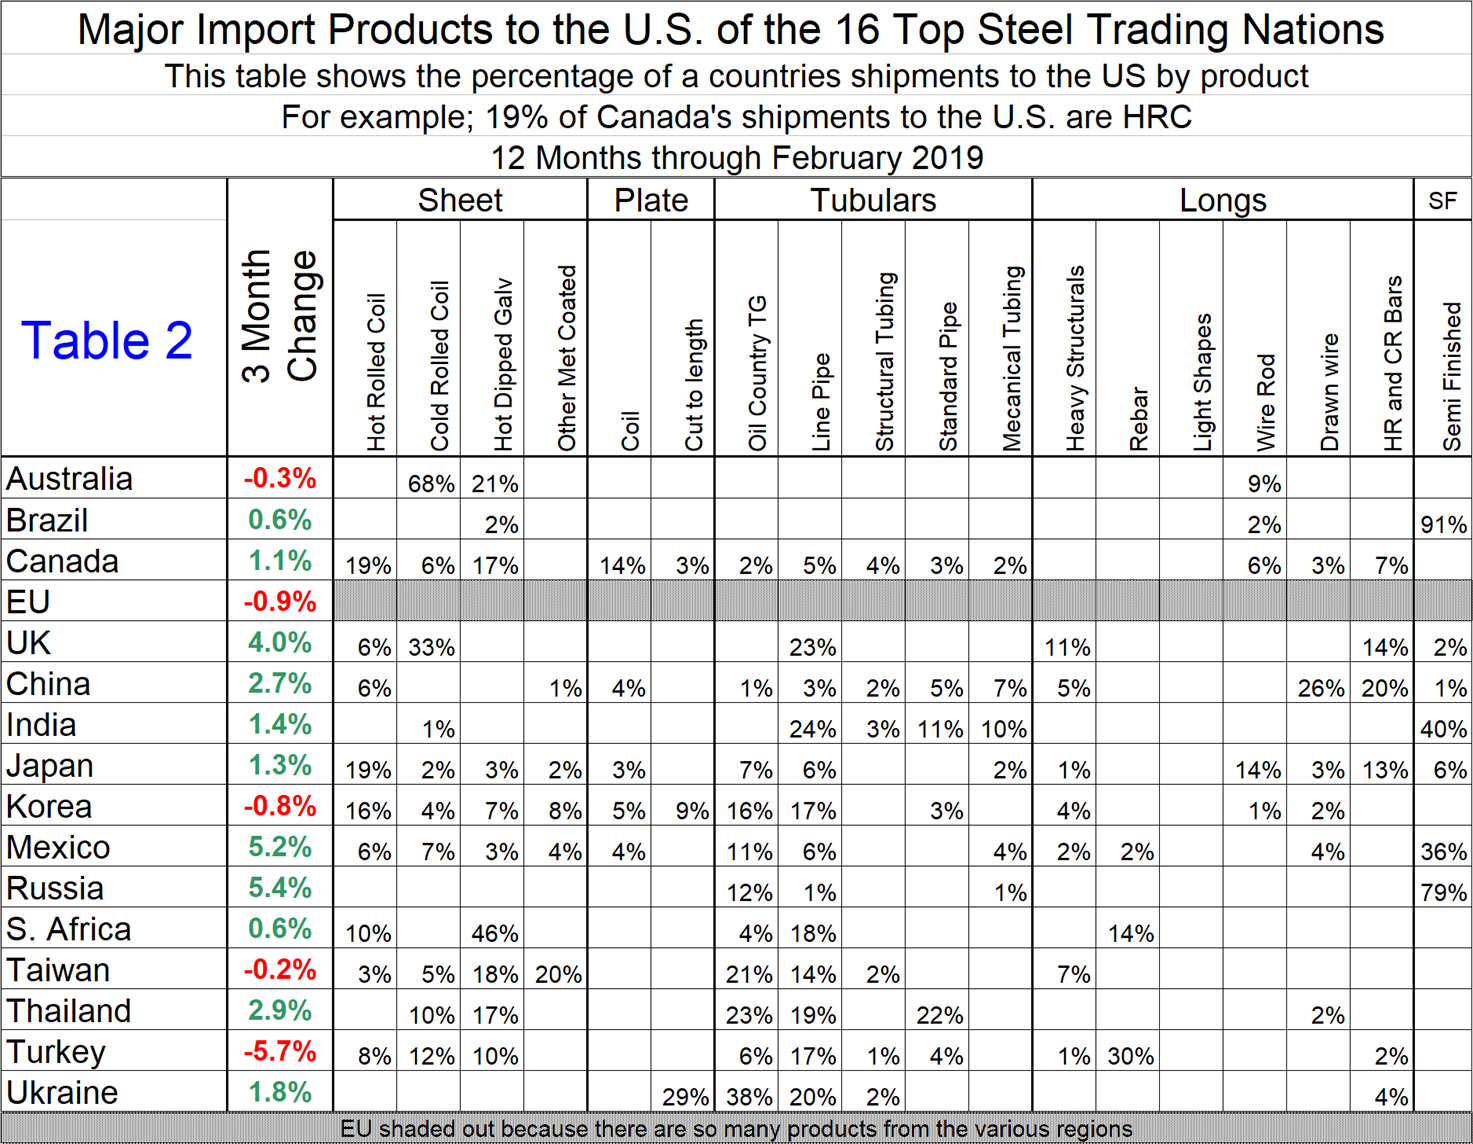
Once or twice a year we examine recent currency changes and compare to the steel products that are entering the U.S. from each country.
Table 2 shows that analysis for steel imports from the 16 nations in 12 months through February. It also shows the currency change against the U.S. dollar in the last three months. A buyer of hot rolled coil could determine that there would be a 10.9 percent price advantage in switching sources from Mexico to Turkey. Admittedly, this is an over the shoulder view, but we think it’s a piece of the puzzle to be considered.
Explanation of Data Sources: The broad index is published by the Federal Reserve on both a daily and monthly basis. It is a weighted average of the foreign exchange values of the U.S. dollar against the currencies of a large group of major U.S. trading partners. The index weights, which change over time, are derived from U.S. export shares and from U.S. and foreign import shares. The data are noon buying rates in New York for cable transfers payable in the listed currencies. At SMU, we use the historical exchange rates published in the Oanda Forex trading platform to track the currency value of the U.S. dollar against that of 16 steel and iron ore trading nations. Oanda operates within the guidelines of six major regulatory authorities around the world and provides access to over 70 currency pairs. Approximately $4 trillion U.S. dollars are traded every day on foreign exchange markets.


