Market Data

December 21, 2018
SMU Currency Analysis: Dollar in a Strong Position
Written by Peter Wright
Editor’s note: Steel Market Update is sharing the following Premium content with all its readers in this issue. For more information on how to upgrade to a Premium-level subscription, email info@SteelMarketUpdate.com.
The U.S. dollar now has the highest value on the foreign exchange markets in over 16 years. In the last month, the dollar strengthened against nine of the 16 currencies that Steel Market Update tracks. This was a similar performance to each of the previous three months. Please see the end of this report for an explanation of data sources.
Currency analysis is a highly complex yet important requirement for steel industry corporate management. As we produce this update, we look for expert opinion to flush out the values of the 16 steel trading nations that we track. Stocks fell across the globe overnight on Dec. 19 after the FOMC lifted interest rates for the fourth time this year. Fed Chair Jerome Powell downplayed implications of market volatility and said the central bank would continue its balance-sheet runoff. The European Bank is still far from its first increase. In Japan rates are negative. China has relaxed its monetary policy in response to a weakening economy. When interest rates rise in America and nowhere else, the dollar strengthens, making it harder for emerging markets to repay their dollar debts.
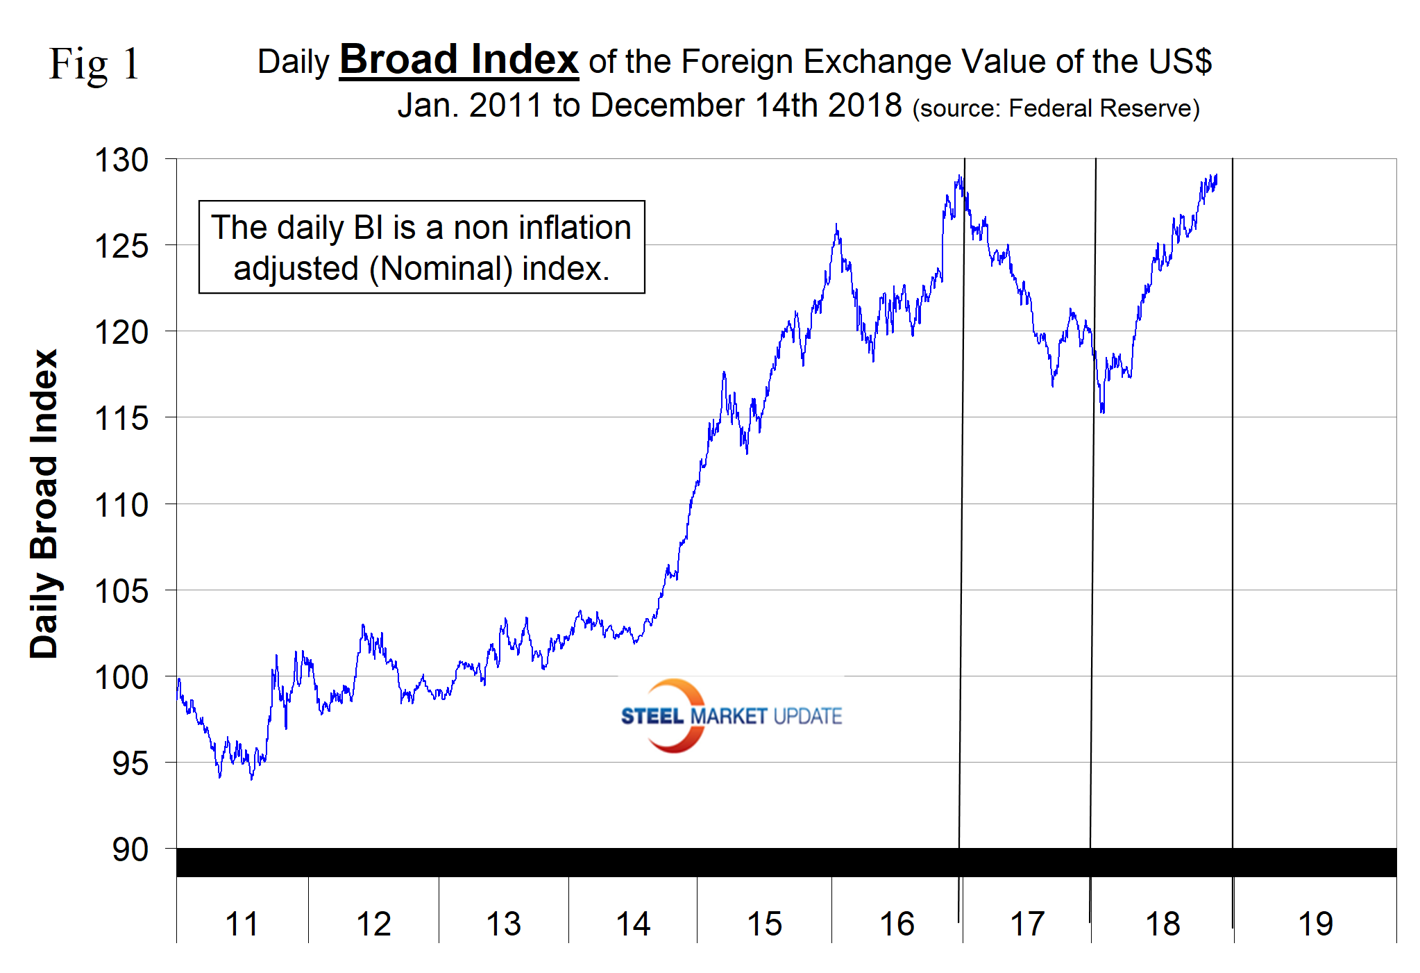
The Broad Index value of the U.S. dollar is reported several days in arrears by the Federal Reserve; the latest value published was for Dec. 14. Figure 1 shows the index value since January 2011. The dollar now has the highest value since March 2002 with an index value of 129.12. The recent low point was Feb. 1, 2018, at 115.21. A primary driver of the value of the U.S. dollar is the differential between U.S. interest rates and those of our major trading partners.
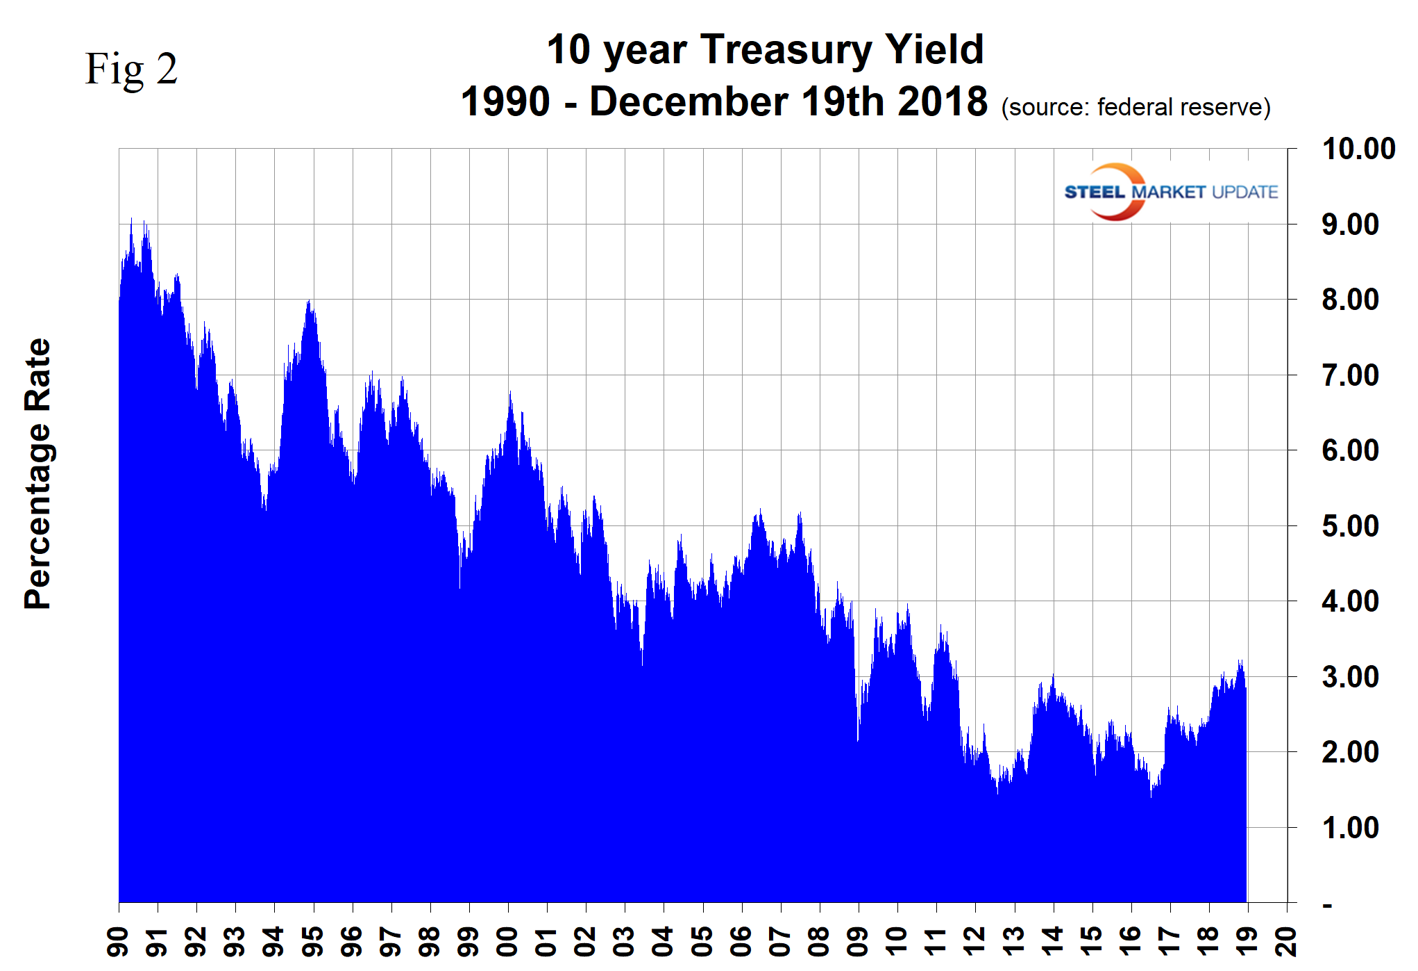
On Dec. 19, the Fed enacted its fourth rate hike this year and the ninth time this cycle. The increase was universally expected. Figure 2 describes the 10-year Treasury yield through Dec. 19 on which date the rate was 2.77 percent, down from a seven-year high of 3.24 percent on Nov. 8. Short term rates of less than 1 year have increased since Nov. 8, but all longer terms have decreased with the result that the yield curve is flattening.
Each month, SMU publishes an update of Table 1, which shows the value of the U.S. dollar against the currencies of 16 major global steel and iron ore trading nations. The table shows the change in value in one year, three months, one month and seven days through Dec. 19. Currencies that weakened against the U.S. dollar are color coded in red. Green indicates currencies that strengthened against the U.S. dollar.
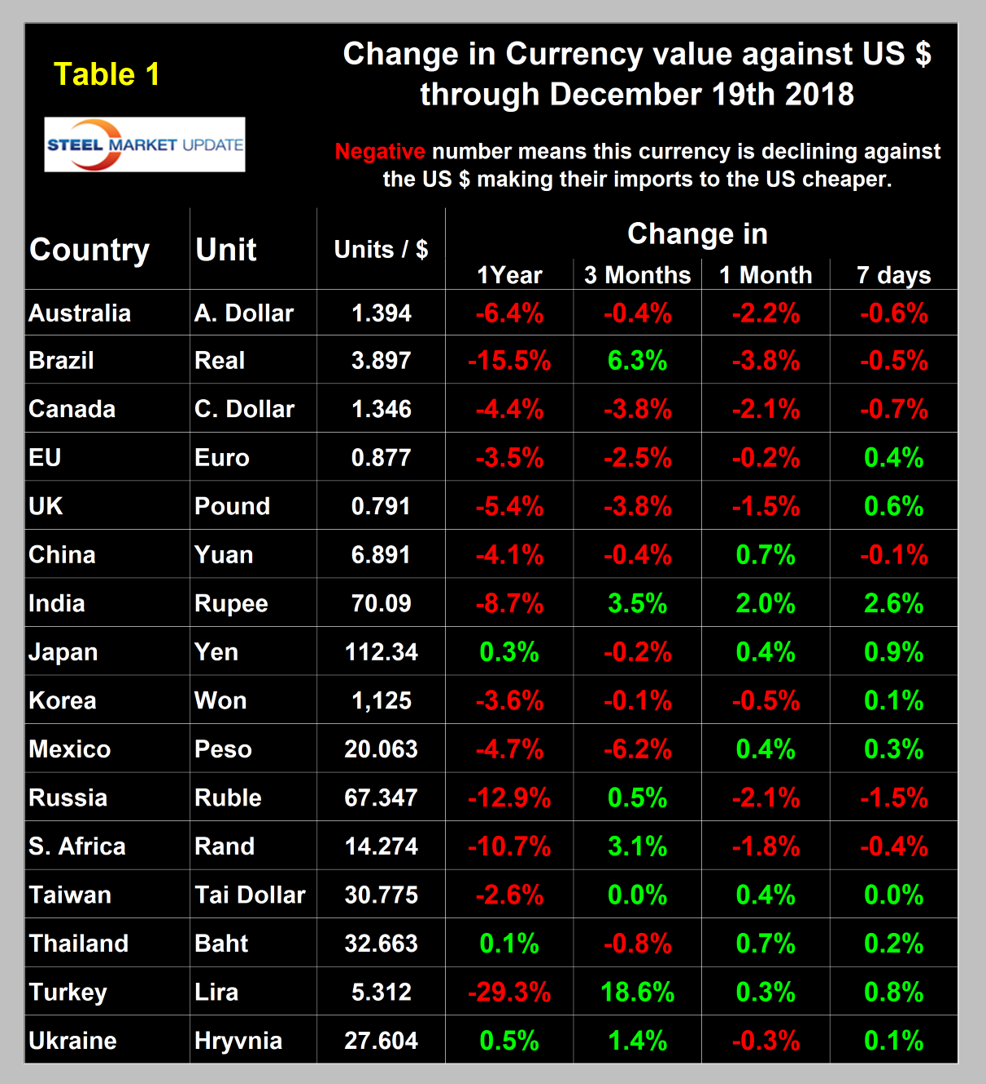
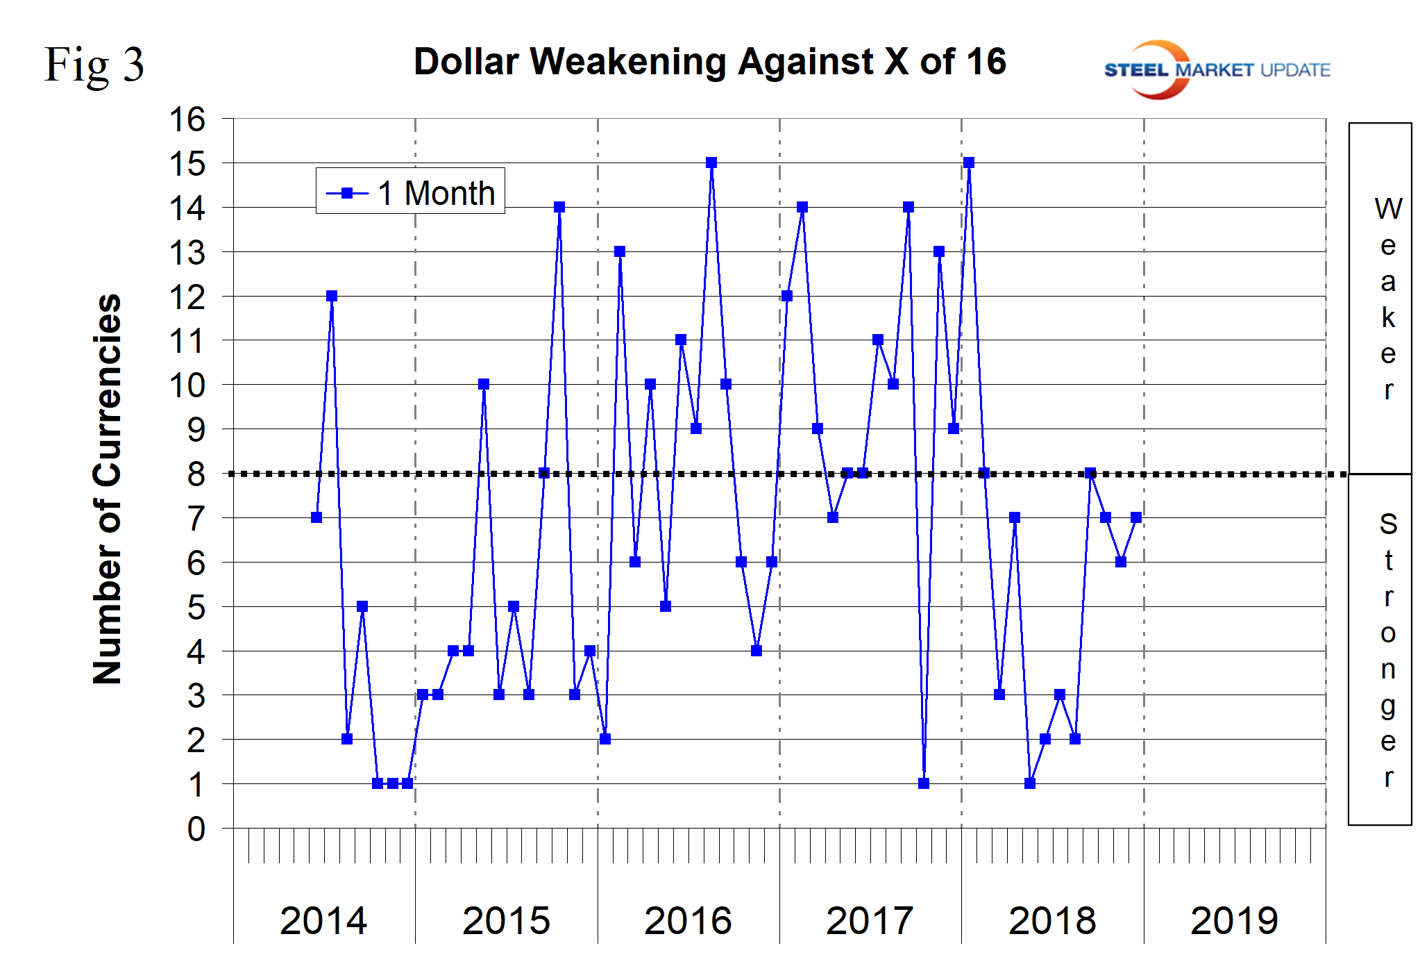
Figure 3 gives a longer-range perspective and shows the extreme gyrations that have occurred in the last three years at the one-month level. Through Dec. 19, the dollar strengthened against nine of the 16 in one month and weakened against the other seven. On average in our last four reports, the dollar has strengthened against 10 of the 16; therefore, the steel trading currencies are behaving in a similar way to those that compose the broad index.
A falling dollar puts upward pressure on commodity prices that are greenback denominated. We regard strengthening of the U.S. dollar as negative and weakening as positive because of the effect on the trade balance of all commodities and on the total national trade deficit.
In each of these reports, we comment on several of the 16 steel and iron ore trading currencies listed in Table 1, and over a period of several months will describe the history of all of them. Charts for each of the 16 currencies are available through Dec. 19 for any premium subscriber who requests them.
British Pound
In the last three months, the British pound has declined by 3.8 percent of which 1.5 percent occurred in the last month (Figure 4). In this writer’s opinion (having just returned from the UK) the Brexit situation is an imminent disaster. Now that the British people have a better idea of the consequences, the best option is another referendum in which hopefully sense will prevail. Through Dec. 18 year-to-date, the U.S. had imported 30.3 million metric tons of semi-finished and rolled steel products. As a supplier of imports, the UK was in 13th place with 265,000 metric tons. On Dec. 18, analyst Sankalp Soni wrote: “The EU has repeated that they will not renegotiate Brexit. The UK now only has a month left until the parliamentary vote on an exit deal. There is little chance that parliament will approve what Prime Minister May has negotiated and even less that it can be improved. The likelihood of a no-deal Brexit is increasing. This event comes with its own set of uncertainties as businesses and markets would be unclear on how to move forward, and thus this could send the pound plummeting.”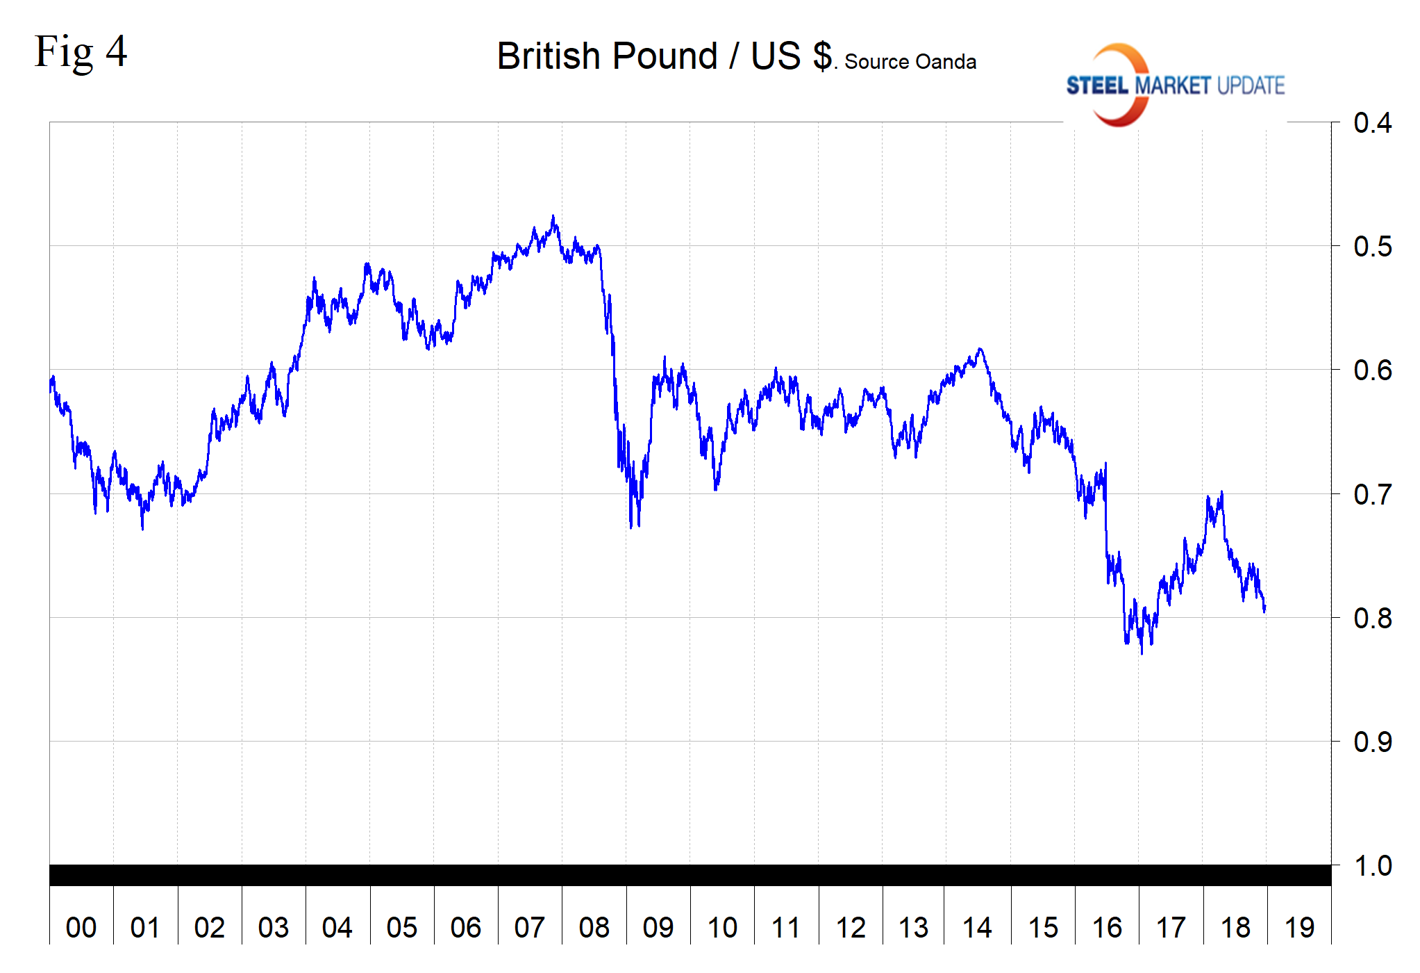
Chinese Yuan
Through Dec. 18 year-to-date, China was in 10th place as a steel importer to the U.S. with a total of 625,000 metric tons (Figure 5). Of this, by far the highest volume item was drawn wire, which reflects trade restrictive legislation on rolled products and China’s desire to move up the value chain. This is obviously very bad for the U.S. wire drawing industry and for the rod rollers. In the last three months the yuan has declined by 0.4 percent, but in the last month it has rallied by 0.7 percent. On Dec. 19, China banking analyst Sarah Hsu wrote: “China’s currency has taken a beating due to a slowing economy and the U.S.-China trade war. The yuan has been flirting with the 7 to the dollar exchange ratio since this summer, reducing the overseas purchasing power of Chinese travelers. The Chinese central bank has attempted to stall the currency’s decline in value since August by intervening in currency markets to buy yuan, but this has had a limited impact. Although we don’t exactly know how China’s currency strategy works, we know that too much depreciation would spook currency markets. The aim therefore is to keep the exchange rate from reaching the psychologically significant 7 yuan to dollar rate and to maintain stability. That being said, the central bank has intervened less this year than during the last period of depreciation in 2014-2016, when the People’s Bank of China spent about $1 trillion to shore up the yuan. Many China bears are shorting the yuan as well as yuan proxies like the Australian and New Zealand dollars, the Korean won, and the Singaporean dollar. For these countries, China is a major export market.”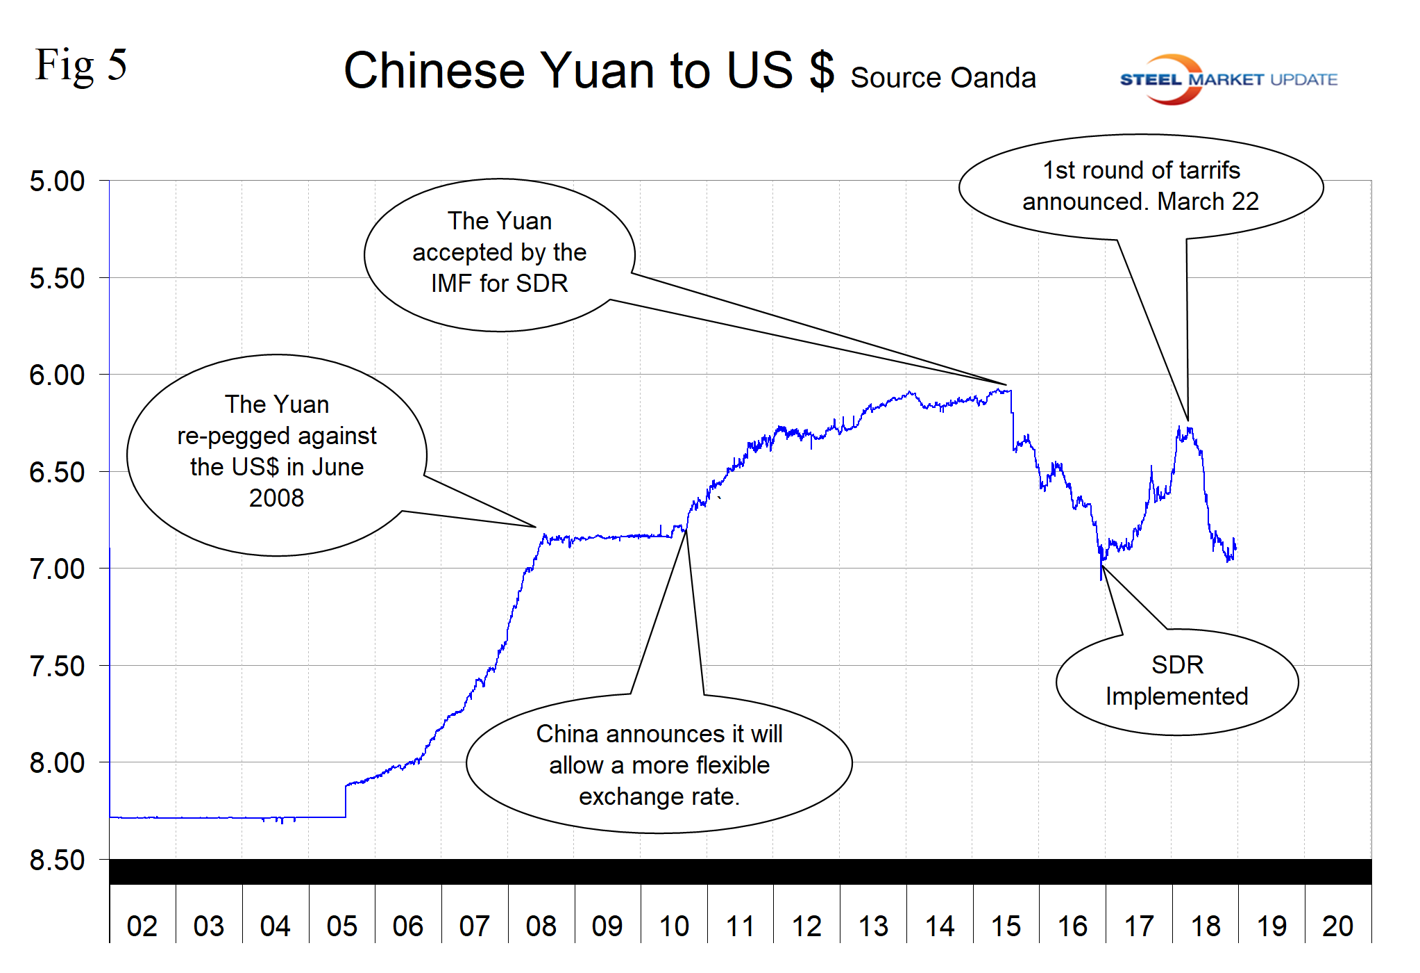
South African Rand
In the last three months, the rand has strengthened by 3.1 percent, but gave back 1.8 percent in the last month (Figure 6). Through Dec. 18 year-to-date, South Africa was in 19th place as a steel importer to the U.S. with a total of 198,000 metric tons. On Nov. 30, Blue Quadrant Capital Management wrote: “As we have written previously, investors should remain cautious with regard to South Africa financial assets, the currency and in particular domestically focused companies. The government’s debt trajectory, having already deteriorated significantly this year as highlighted in the recent mid-term budget update, is only likely to deteriorate further. Whatever option or policy choices the current administration opts for, it will likely at some point also lead to a much weaker currency, something which in itself is likely required in order to help stimulate the country’s supply-side sectors.”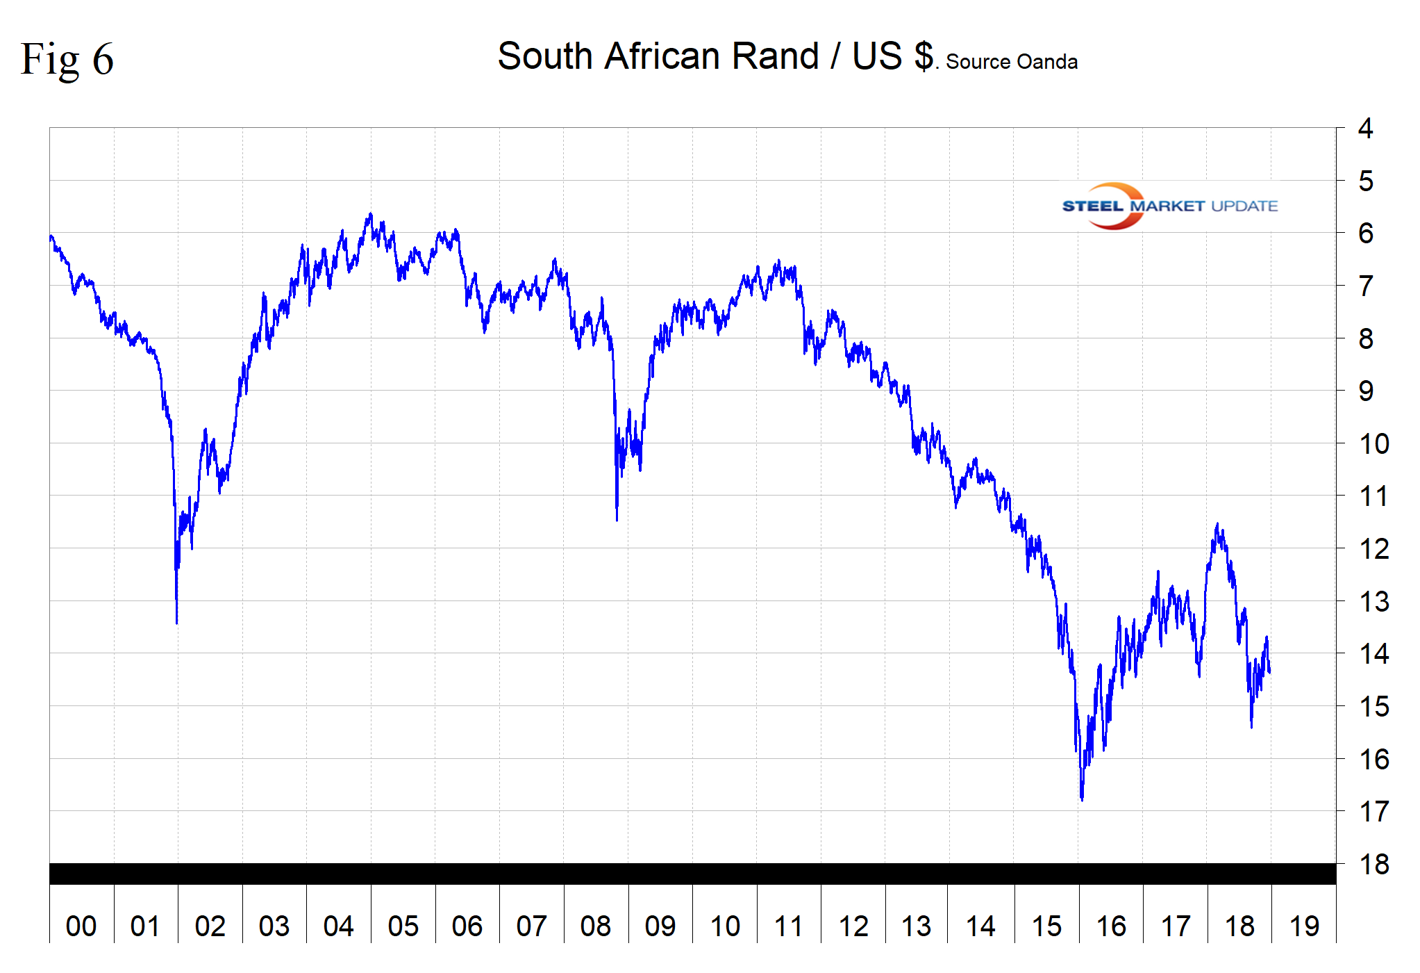
Taiwanese Dollar
Taiwan’s dollar was unchanged in the last three months, but in one month had risen by 0.4 percent. Of all the 16 currencies in this analysis, the Taiwanese dollar has been the most stable for over 20 years. Through Dec. 18 year-to-date, Taiwan was in 9th place as a steel importer to the U.S. with a total of 952,000 metric tons (Figure 7).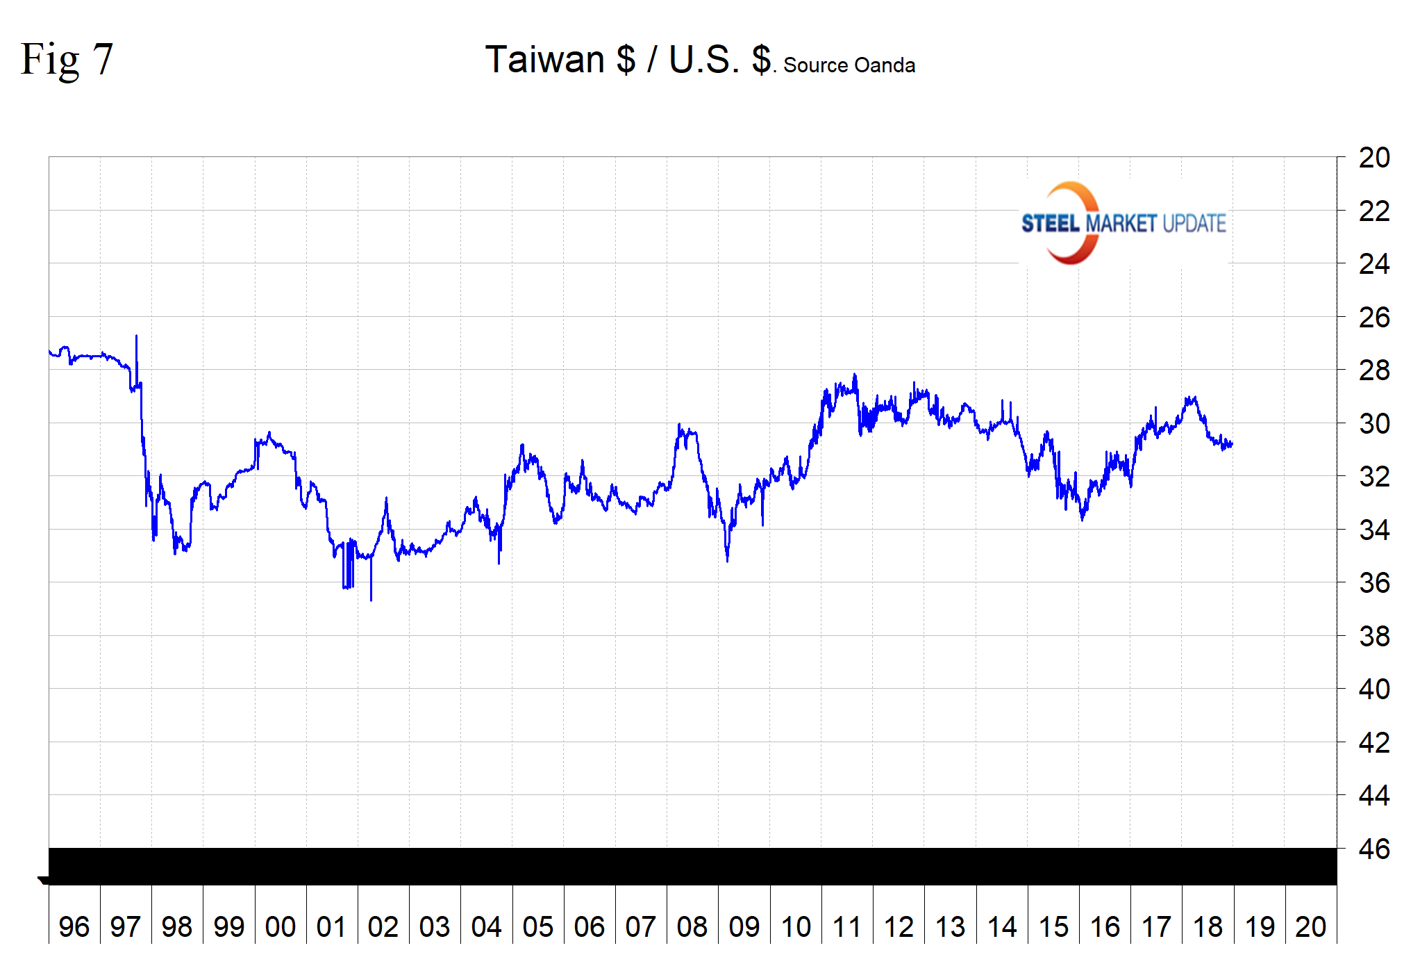
Thai Baht
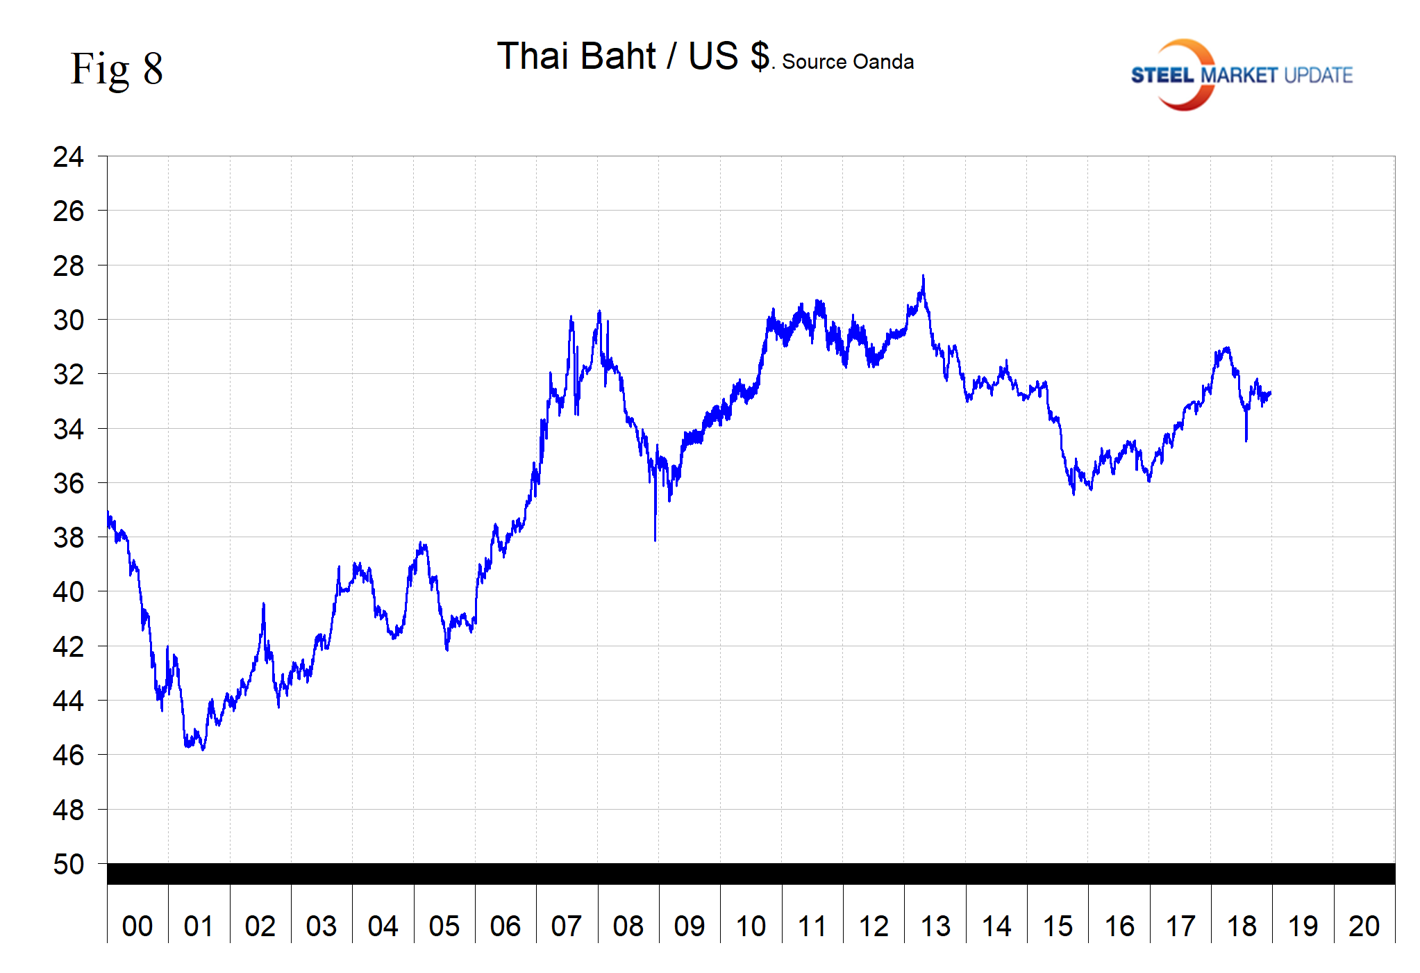
Thailand’s baht has declined by 0.8 percent in three months, but gained back 0.7 percent in the last month (Figure 8). Through Dec. 18 year-to-date, Thailand was in 11th place as a steel importer to the U.S. with a total of 337,000 metric tons.
Explanation of Data Sources: The broad index is published by the Federal Reserve on both a daily and monthly basis. It is a weighted average of the foreign exchange values of the U.S. dollar against the currencies of a large group of major U.S. trading partners. The index weights, which change over time, are derived from U.S. export shares and from U.S. and foreign import shares. The data are noon buying rates in New York for cable transfers payable in the listed currencies. At SMU, we use the historical exchange rates published in the Oanda Forex trading platform to track the currency value of the U.S. dollar against that of 16 steel and iron ore trading nations. Oanda operates within the guidelines of six major regulatory authorities around the world and provides access to over 70 currency pairs. Approximately $4 trillion U.S. dollars are traded every day on foreign exchange markets.


