

Market Data

December 17, 2018
Drill Down of Cold Rolled Imports into Product Detail
Written by Tim Triplett
Through October 2018, of the total cold rolled sheet and strip imports into the U.S., only 2.8 percent was strip, while 44.3 percent of the CR sheet imports were >1 to 3mm thick and 49.8 percent was full hard.
Premium subscribers to Steel Market Update receive reports on imports broken down into district of entry and source nation (see apology below). This drill down report takes the regional analysis to the level of product detail. Our intent is to report this drill down for HR and CR sheet in alternate months in the rationale that the finer the detail steel buyers have about what is coming into their region, the better job they can do of negotiating with suppliers and the more they know about their competitors’ activities.
Using U.S. International Trade Commission (USITC) data, SMU has taken the import tonnage of cold rolled sheet and broken it down into coil and leveled. Then the analysis breaks out four thickness ranges and identifies how much was full hard, annealed and high strength. Finally, this information is taken to the district of entry level. Total year-to-date sheet and strip imports through October were 1,263,456 and 34,986 metric tons, respectively.
Table 1 is a monthly summary through October and year-to-date 2018 showing gauge range and condition. The total on the first line does not include strip.
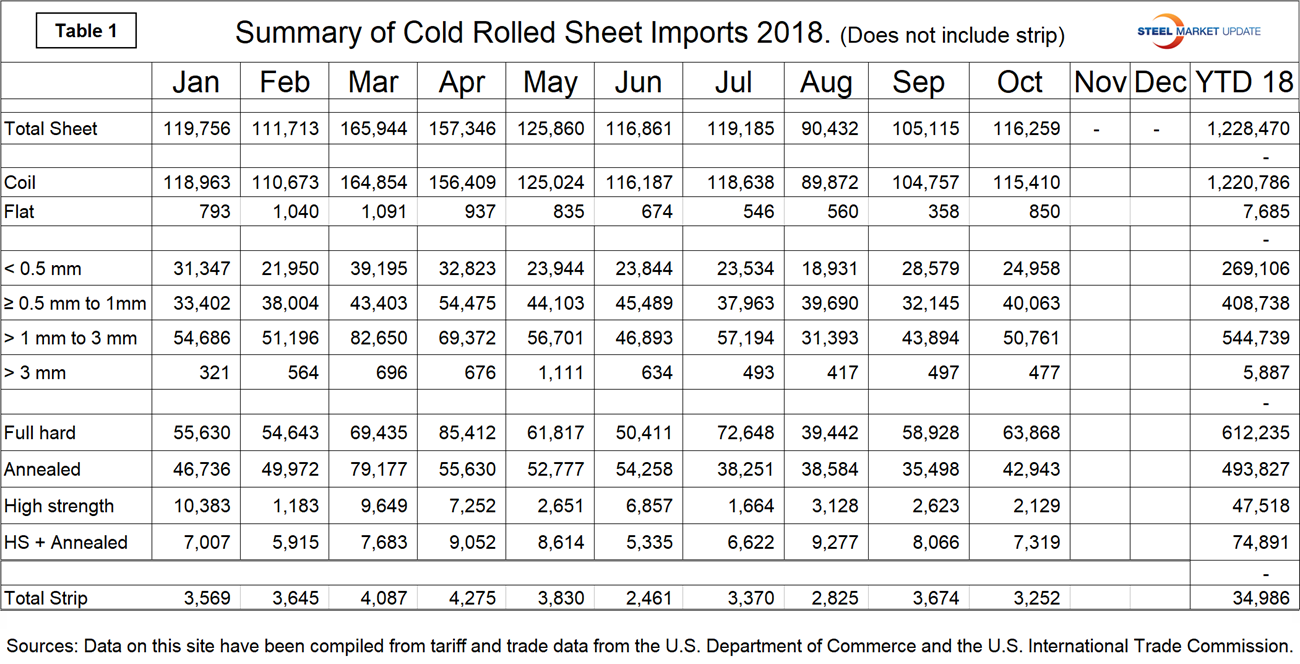
Figure 1 breaks the year-to-date cold rolled sheet tonnage down into the four gauge ranges that are identified in the HTS codes. Year to date October, 21.9 percent was < 0.5 mm, 33.3 percent was ≥ 0.5 mm to 1.0 mm, 44.3 percent was >1.0 to 3.0 mm, and 0.5 percent was > 3.0 mm.
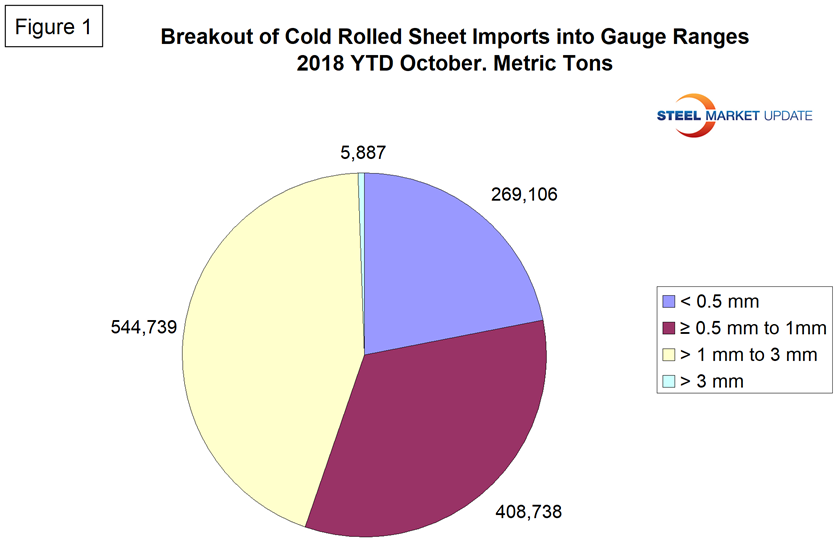
Figure 2 does the same for condition. It identifies the volume of full hard, annealed, high strength and high strength annealed. Year to date October, 49.8 percent was full hard, 40.2 percent was annealed, 3.9 percent was high strength and 6.1 percent was high strength annealed.
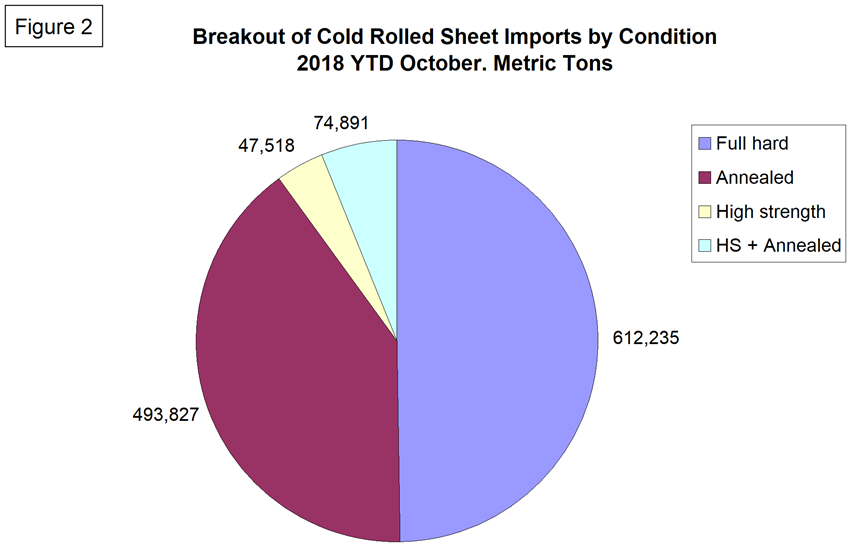
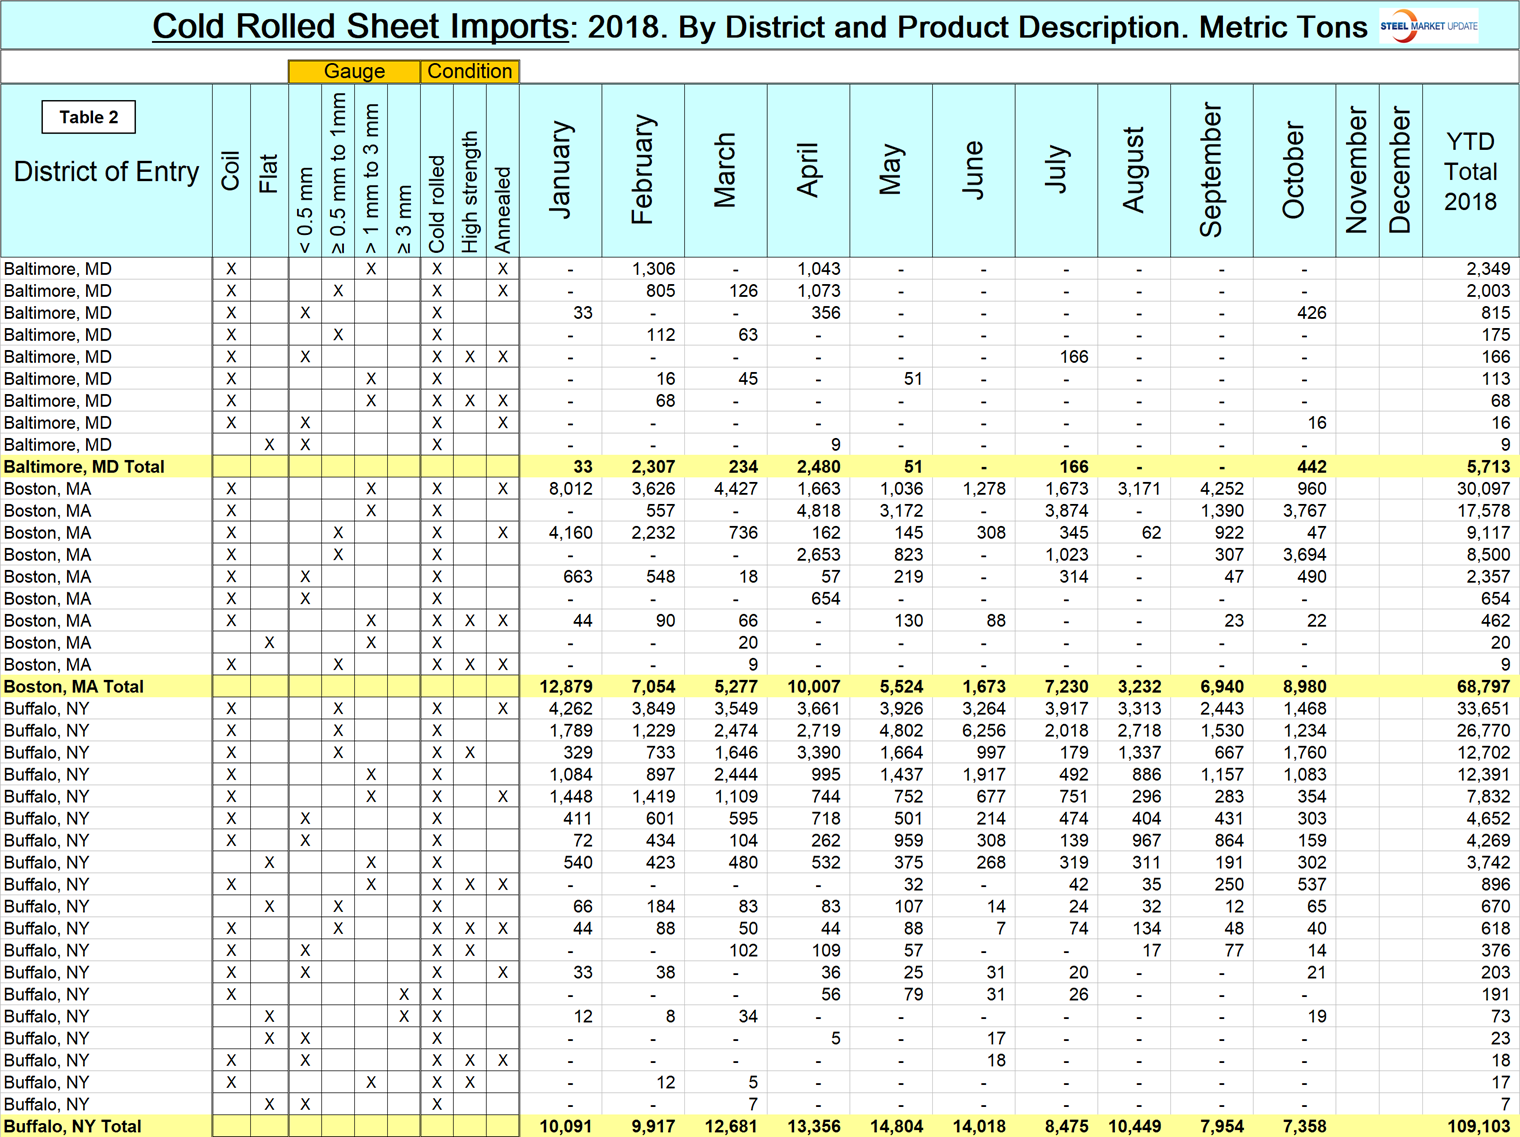
Table 2 is a small part of a sheet that shows detail for every region in the U.S. and is available here. It shows the product detail of cold rolled sheet imports by district of entry. For example, the highest volume item entering Buffalo year to date was ≥0.5 to 1 mm annealed. If a steel buyer in the Detroit region wanted to know how much high strength annealed >1 to 3 mm had entered through that district year to date, to cite another example, the answer is 40,025 metric tons. The buyer could see that the monthly breakdown of that volume has been very consistent, suggesting repeat contractual volume. The buyer, knowing his/her own activity, would then know more about the activities of competing companies in that region.
Note: This data was accessed through the USITC database. All steel traded globally is classified by the Harmonized Tariff System (HTS). The HTS code has 10 digits. The first six are globally universal. The last four are used at the discretion of the nations involved in a particular transaction and are the basis of this report. The way the U.S. uses the last four digits to define products may be different from other nations’ product classification.
Apology: On Oct. 31, the USITC scrapped and replaced their DataWeb with a new program. When we tried to extract the September data early last month, we realized the “improved” program didn’t work for the detail that we require for the SMU analyses. Since then we have been assisting their analysts to identify and correct their problems. As of mid-December, the system has worked for cold rolled, but our entire query structure has been lost and will have to be replaced. It will take about three months before we are up and running again with all the region and source data for CRC, HRC, HDG, OMC, CTL plate and coiled plate. That estimate assumes we don’t run into any more issues.


