Prices

December 13, 2018
HRC Futures: Approaching Bear Market Territory
Written by David Feldstein
The following article on the hot rolled coil (HRC) futures market was written by David Feldstein. As the Flack Global Metals Chief Market Risk Officer, Dave is an active participant in the hot rolled futures market, and we believe he provides insightful commentary and trading ideas to our readers. Besides writing futures articles for Steel Market Update, Dave produces articles that our readers may find interesting under the heading “The Feldstein” on the Flack Global Metals website, www.FlackGlobalMetals.com. Note that Steel Market Update does not take any positions on HRC or scrap trading, and any recommendations made by David Feldstein are his opinions and not those of SMU. We recommend that anyone interested in trading steel futures enlist the help of a licensed broker or bank.
The November ISM Manufacturing PMI gained 1.6 points to 59.3 and beat expectations of a slight drop. More importantly, the move higher meant the index maintained its uptrend.
ISM Manufacturing PMI
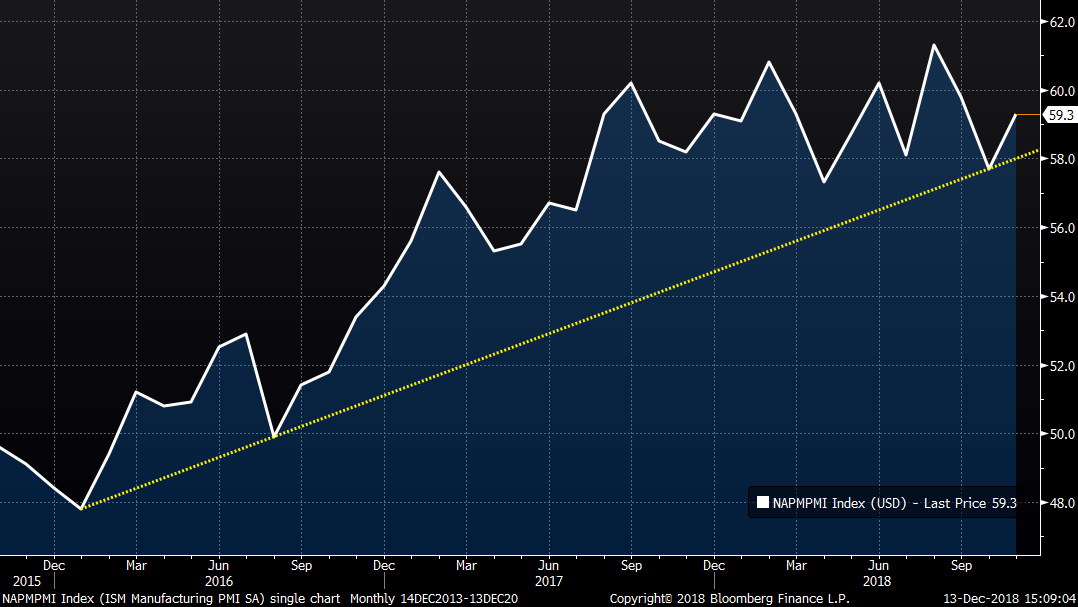
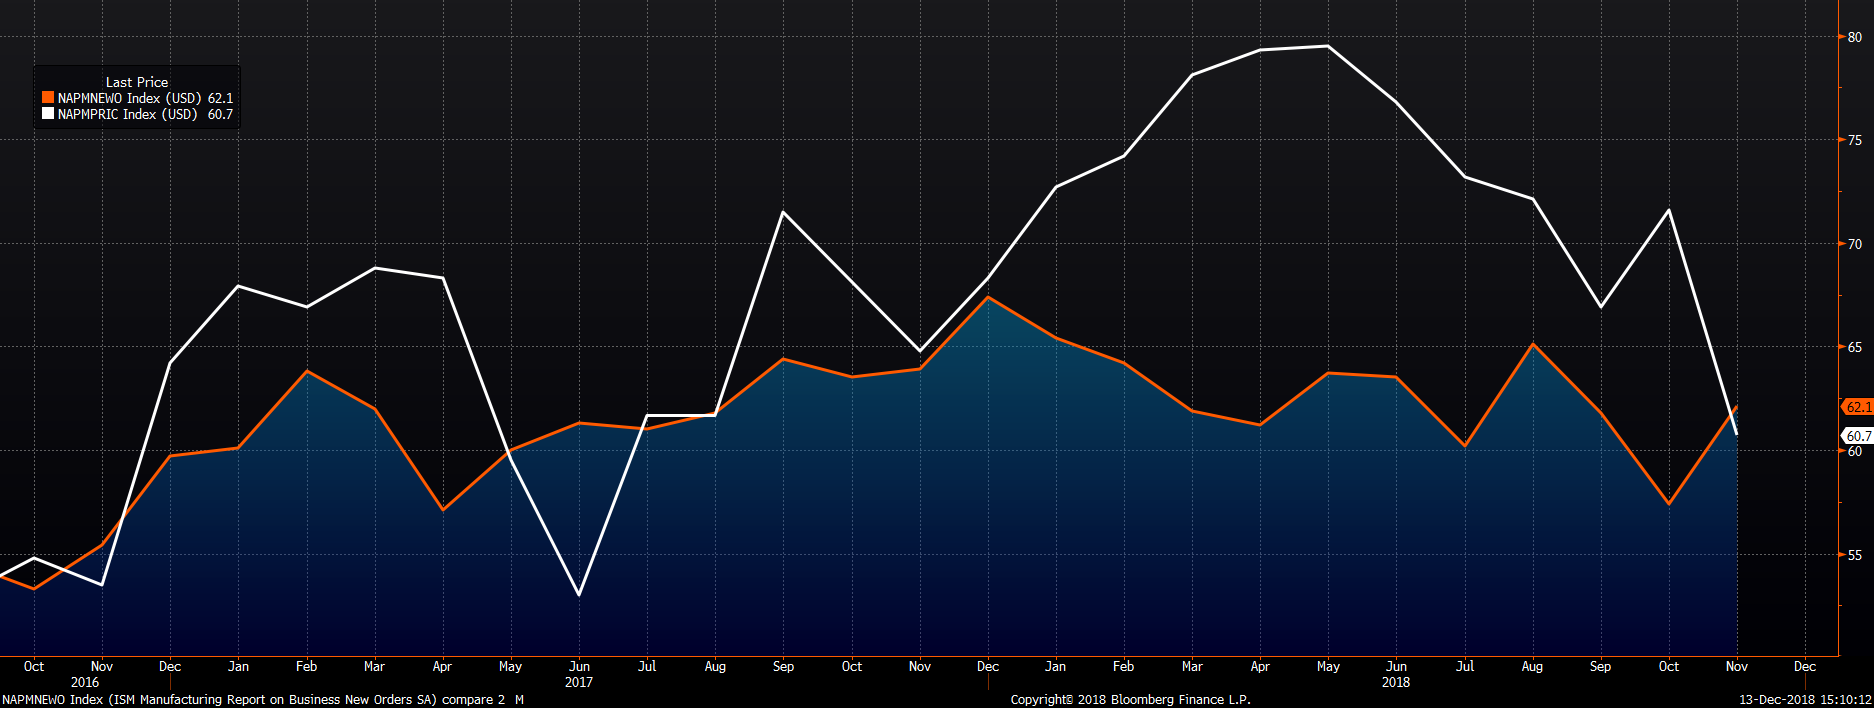
Taking a deeper dive into the index provided an interesting insight. The prices subindex collapsed falling almost 11 points to 60.7, while the new orders subindex jumped back above 60 to 62.1 from 57.4. My interpretation of this is buyers are ultra price sensitive and unwilling to continue to pay up for steel (and other materials). I will be closely watching the release of December’s ISM. If it breaks below 58, then it will have broken below its uptrend that began in January 2016.
ISM Manufacturing PMI New Orders (orange) & Prices Subindexes (white)
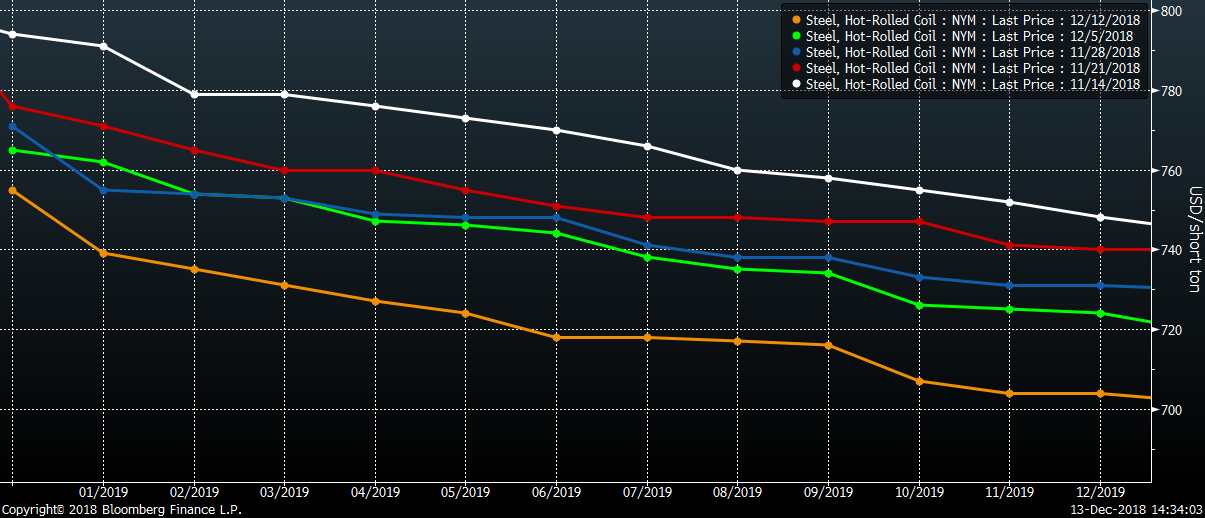
In the Nov. 15 SMU article, I noted the December HRC future was approaching the bottom end of the range it had maintained since June. Shortly after, it broke below that level and the curve has fallen $40-$50/st since.
CME Midwest HRC Futures Curve
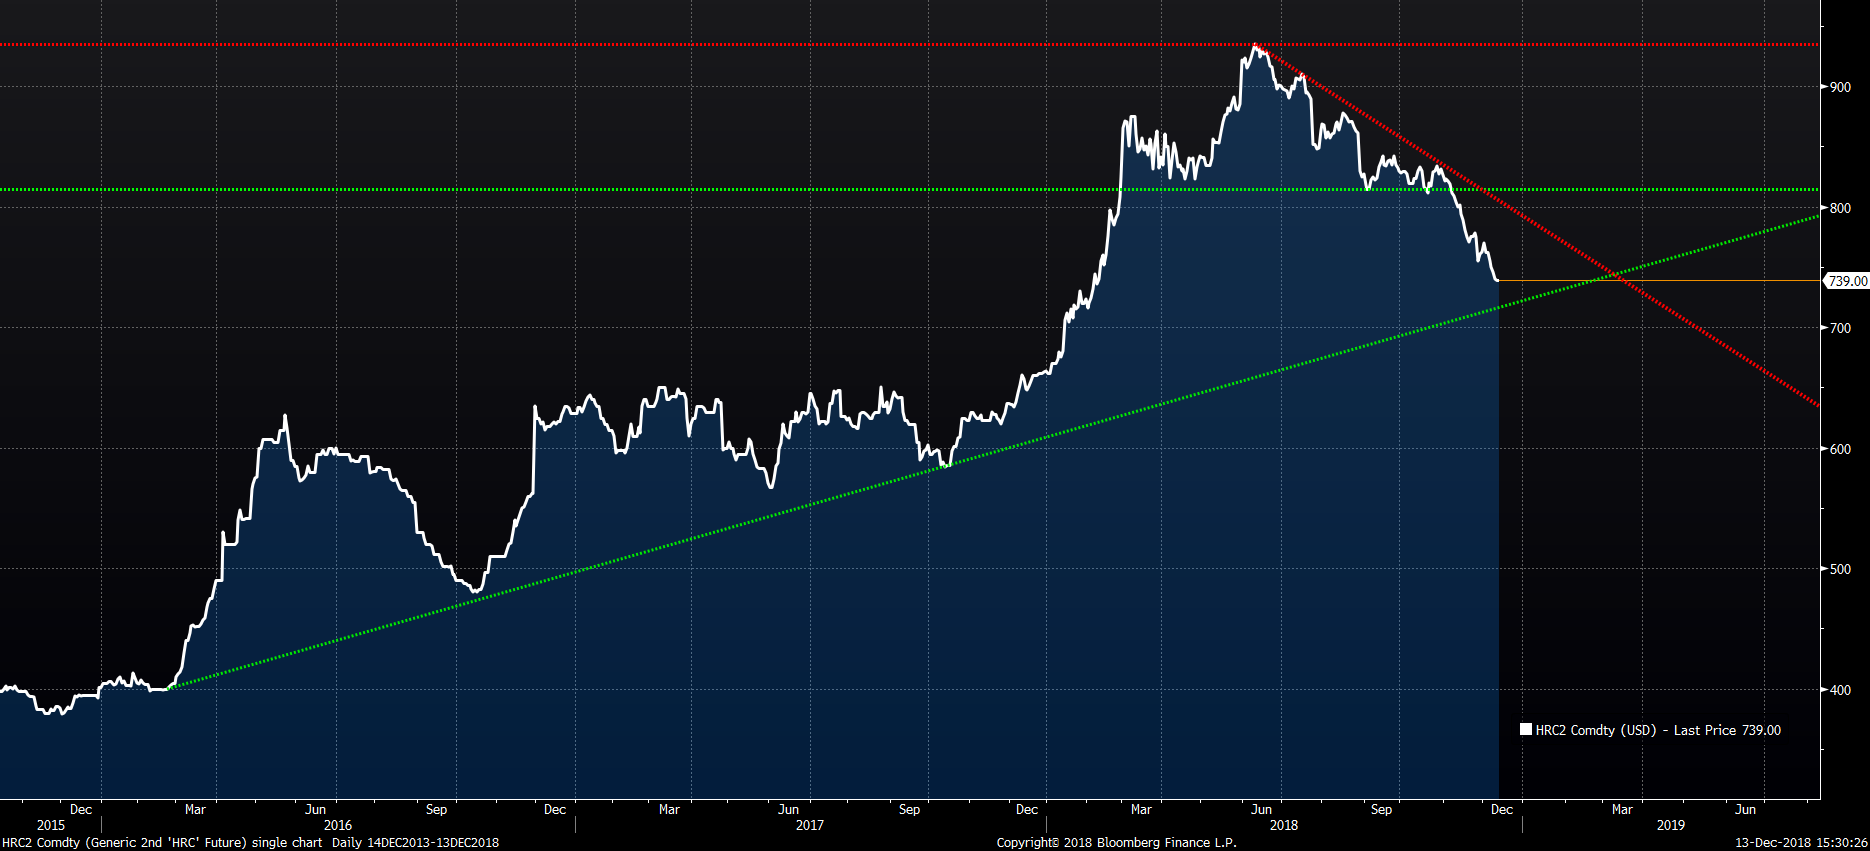
The downtrend in domestic flat rolled price is gaining momentum. This chart shows the long-term uptrend in the rolling 2nd month CME Midwest HRC future starting back in December 2015. The trendline currently sits around $715. If the price breaks below that level, then the long-term uptrend will have concluded and shifted instead into a six-month downtrend. Pay attention to this level to see if there is support or if prices break below it. To be clear, if prices break below $715 with any momentum, then the price will have to fall sharply to find a bottom that will entice buyers to step in.
Rolling 2nd Month CME Midwest HRC Future
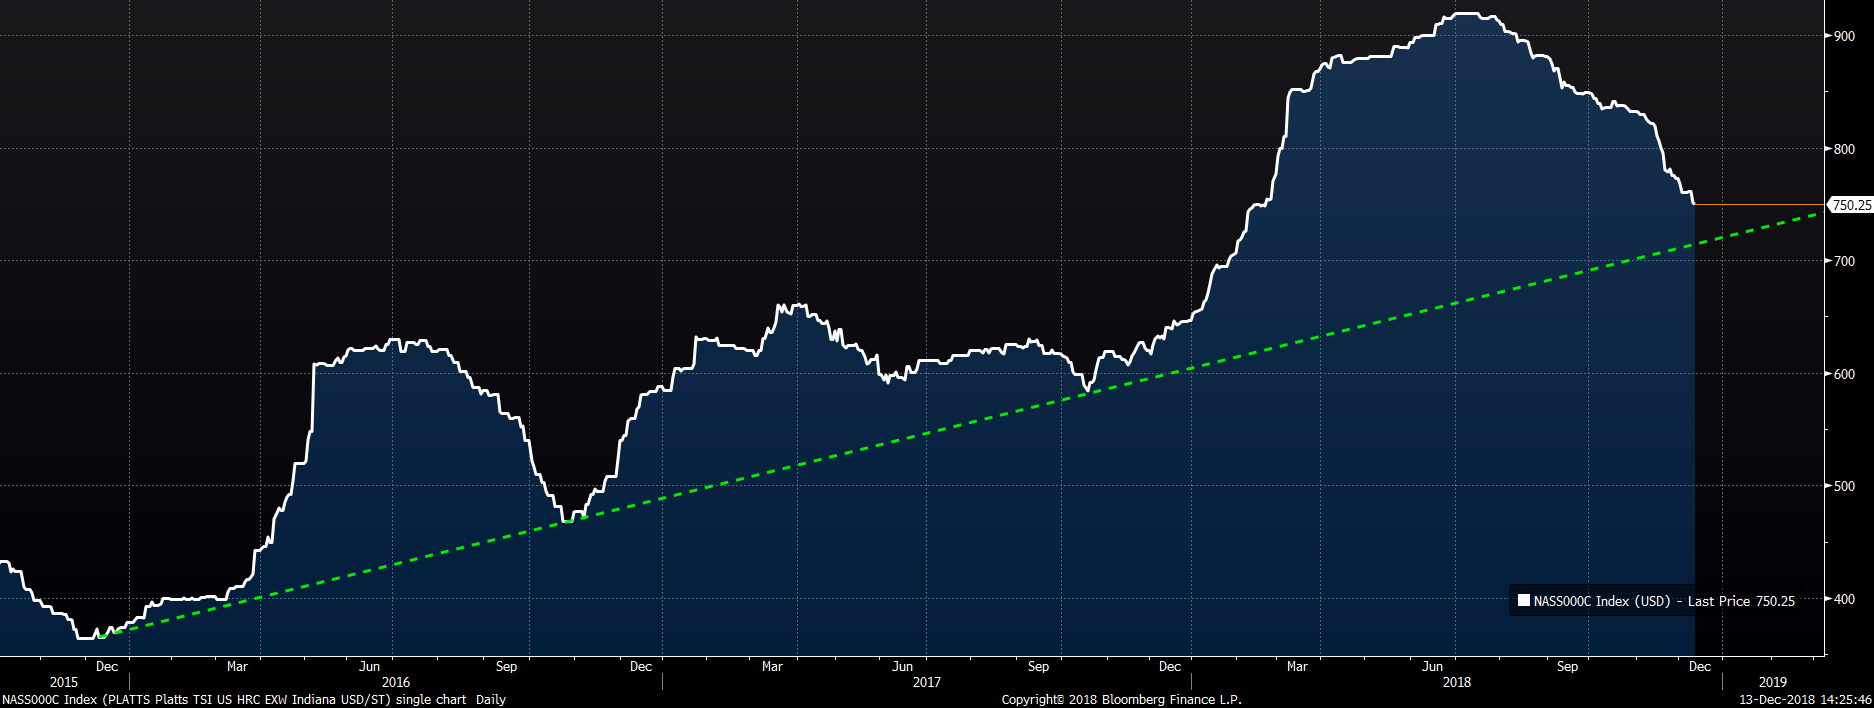
This is the Platts TSI Midwest HRC Index with similar technicals; that is, the index is quickly approaching and threatening the uptrend that started in December 2015. If the index falls below $715, look out!
Platts TSI Midwest HRC Index
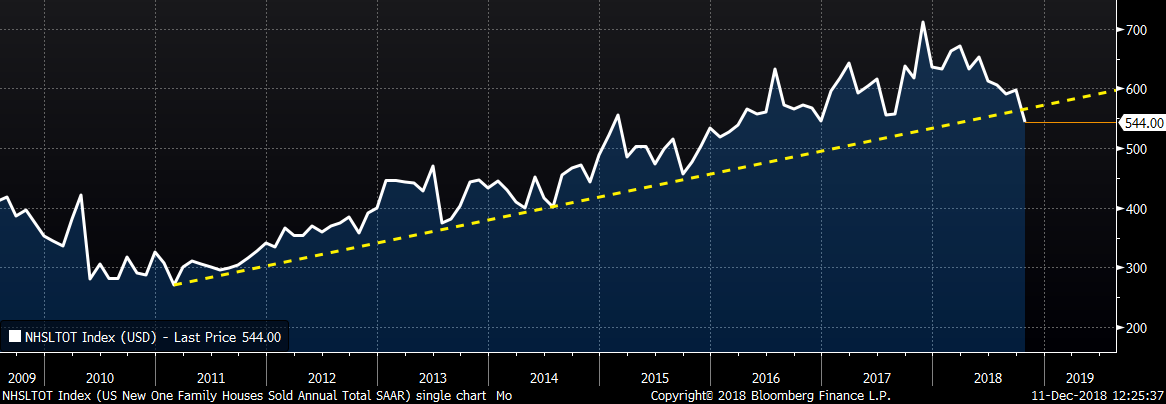
So, what is happening in the steel industry? What could cause prices to fall further? We know there is additional production coming on line and rumor has it that JSW succeeded with its EAF’s first melt this week. Imports continue to stay elevated and HRC prices in the Houston market have been under pressure. How about the demand side? U.S. residential construction has weakened. This chart shows U.S. New Home Sales breaking below its eight-year uptrend.
U.S. Annualized New Home Sales
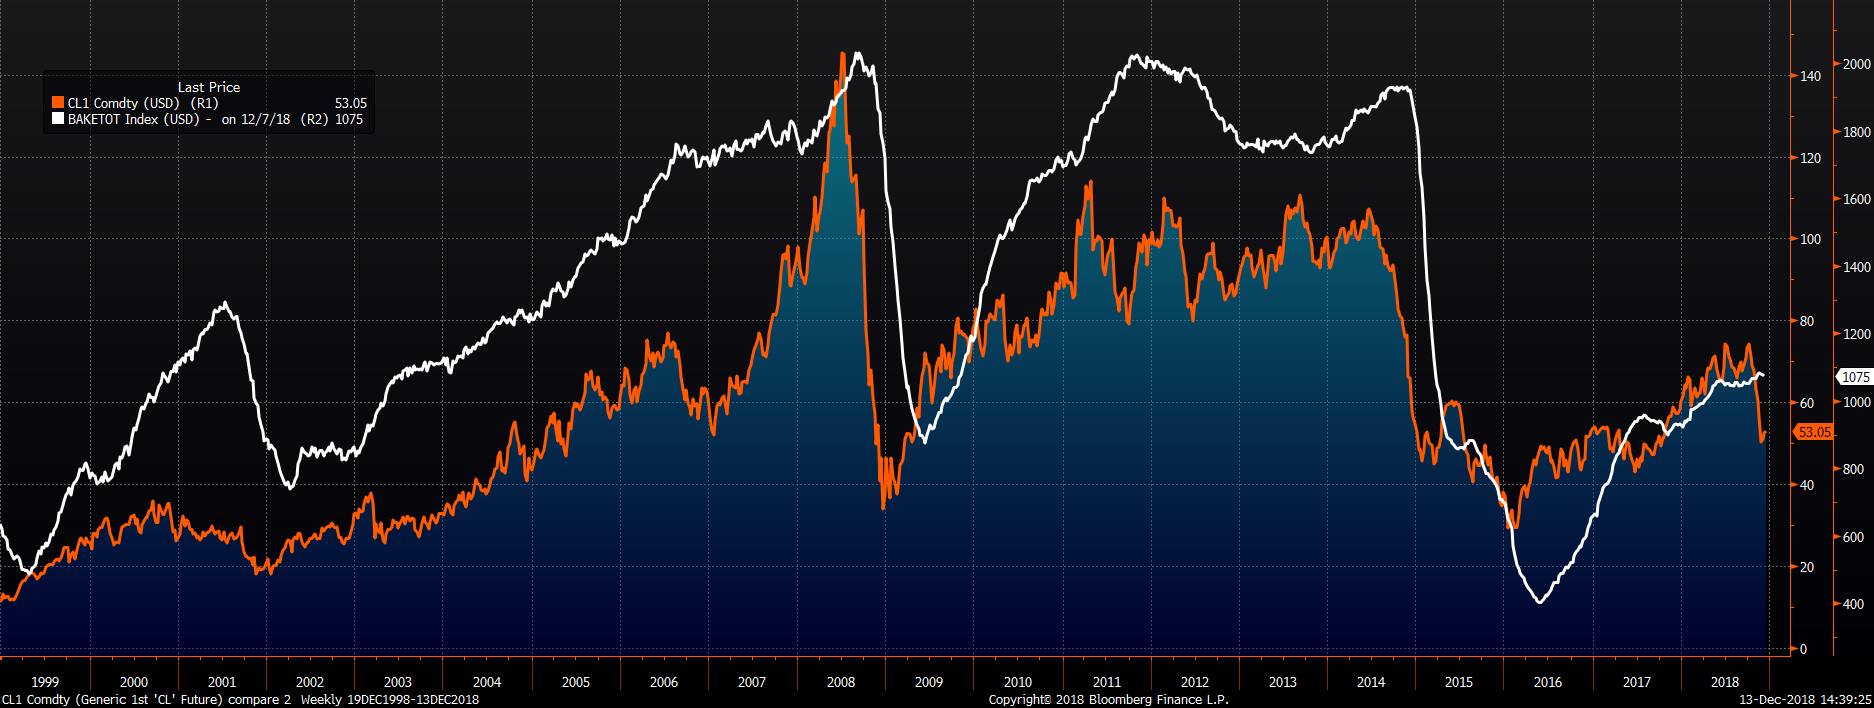
WTI crude oil prices collapsed and have yet to rebound, trading in the $50 to $55 range for weeks. This chart shows that the rig count reliably follows the oil price, but with a lagged effect. There are probably a number of reasons for this, including rig operators taking short-term losses while hoping for a quick price rebound, rig operators cost curve difference and hedges expiring over these months. The bottom line is, if oil prices stay low, expect rig counts to dive. Why do we care? The energy industry accounts for 8-10 percent of steel demand.
Front Month CME WTI Crude Oil Future & Baker Hughes U.S. Rig Count
Based on last Friday’s drop in OCTG prices, it appears these rig operators’ first move is to cut OCTG pipe and tube purchase orders.

Decreased demand colliding with increased production is a recipe for disaster. Falling steel prices, weak order books and anemic mill lead times compounded by weakening growth and deteriorating fundamentals further exacerbate the uncertainty. The back-to-back sharp drops in flat rolled indexes over the past two weeks have reinforced buyers’ entrenched belief that prices are going lower as we approach the year-end industry slowdown.
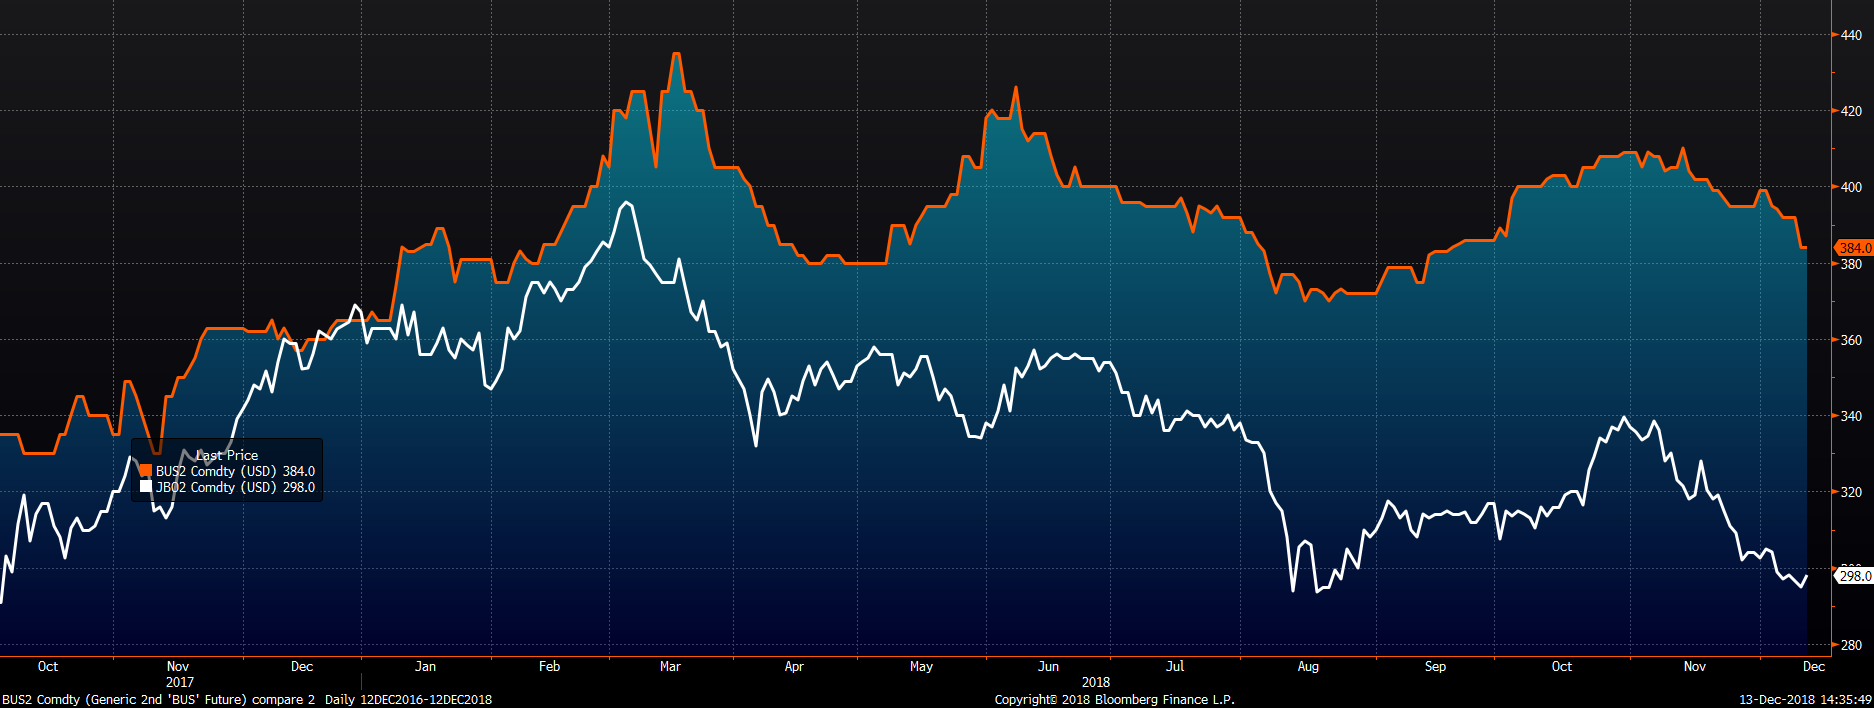
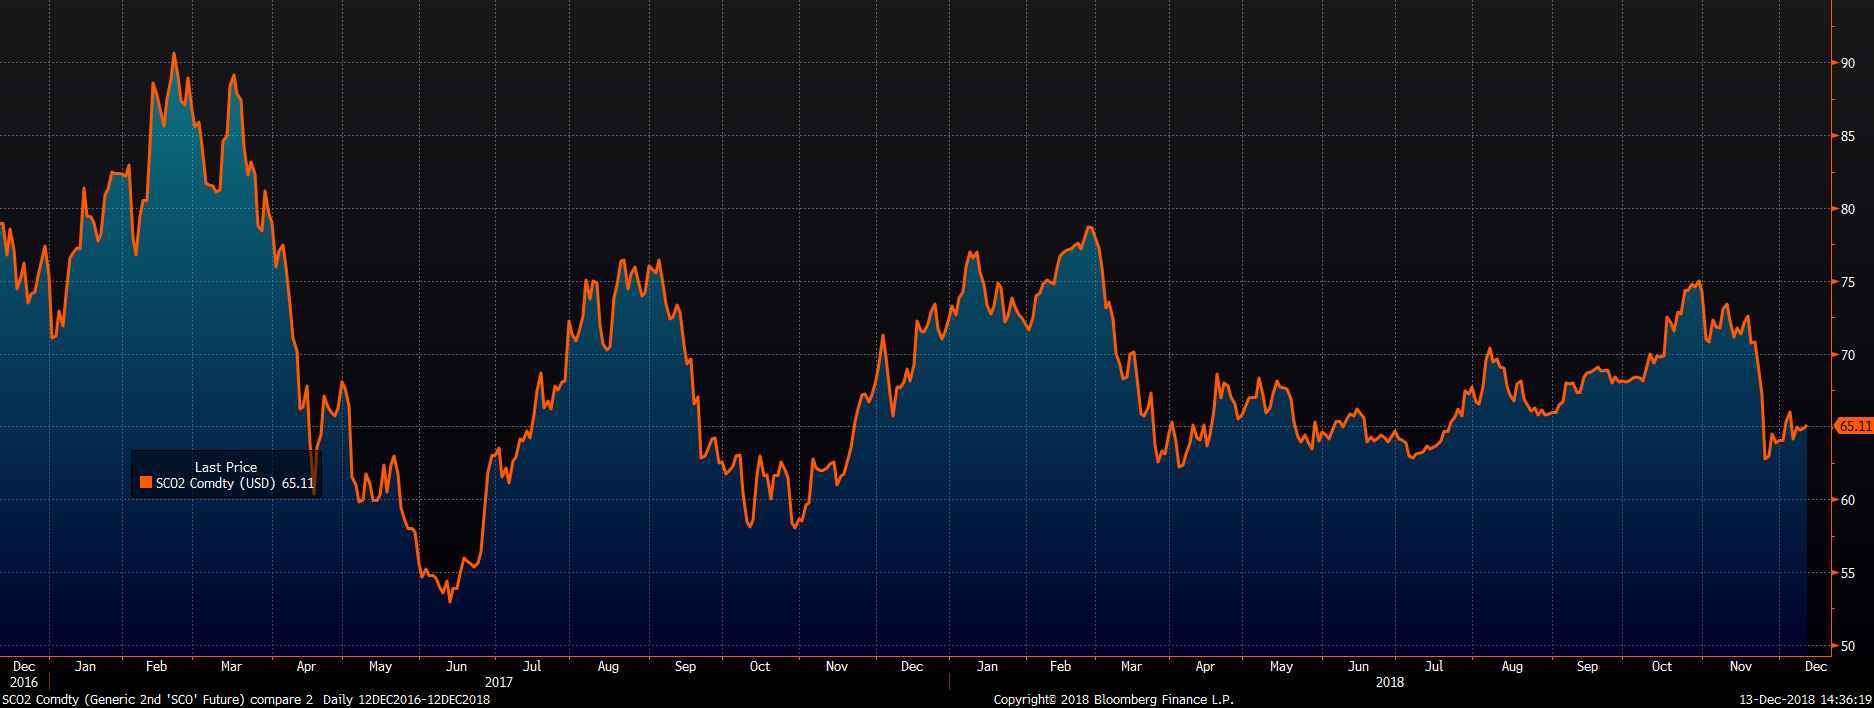
Oil and scrap have a strong correlation, another negative for steel caused by the drop in oil prices. As you can see below, both CME busheling and LME Turkish scrap futures have been moving lower in recent weeks.
2nd Month CME Busheling Future & 2nd Month LME Turkish Scrap Future
Interestingly, one source of optimism is coming from China, where iron ore futures have seen a slight rebound…
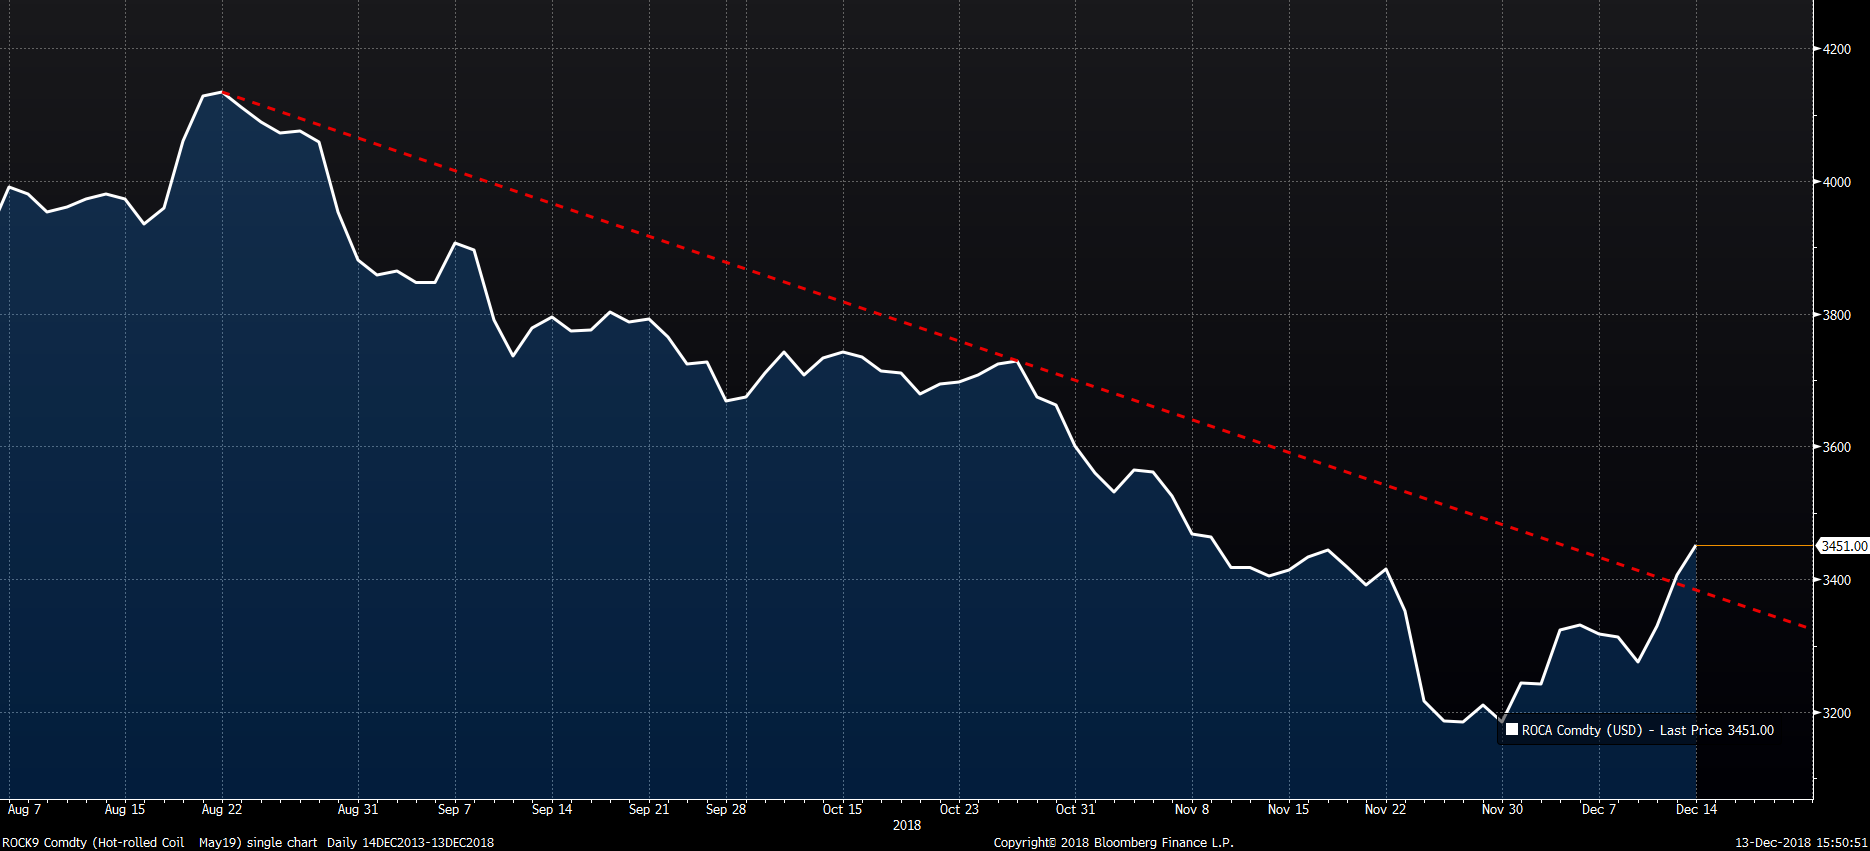
While May Chinese HRC futures broke above its four-month downtrend this week.
May Shanghai Chinese HRC Future (yuan)
