Prices

August 2, 2018
HRC Futures: Complex Choices
Written by David Feldstein
The following article on the hot rolled coil (HRC) futures market was written by David Feldstein. As the Flack Global Metals Director of Risk Management, Dave is an active participant in the hot rolled futures market, and we believe he provides insightful commentary and trading ideas to our readers. Besides writing futures articles for Steel Market Update, Dave produces articles that our readers may find interesting under the heading “The Feldstein” on the Flack Global Metals website, www.FlackGlobalMetals.com. Note that Steel Market Update does not take any positions on HRC or scrap trading, and any recommendations made by David Feldstein are his opinions and not those of SMU. We recommend that anyone interested in trading steel futures enlist the help of a licensed broker or bank.
The CME HRC futures curve continues to be backwardated (downward sloping), which has presented a complex set of choices for market participants with opposing commercial needs. OEM’s/steel buyers’ reluctance to hedge last fall when HRC futures were trading in the low $600s has seemed to persist all year with the majority of participants expecting an imminent sharp price correction for months now. The downward sloping curve is one piece of evidence of this reluctance. Others include the super-low ISM customer inventory subindex, the falling MSCI flat rolled inventory level and durable goods data. Also, comments and earnings announcements from publicly traded manufacturing firms have indicated the group has borne the brunt of the price rally.
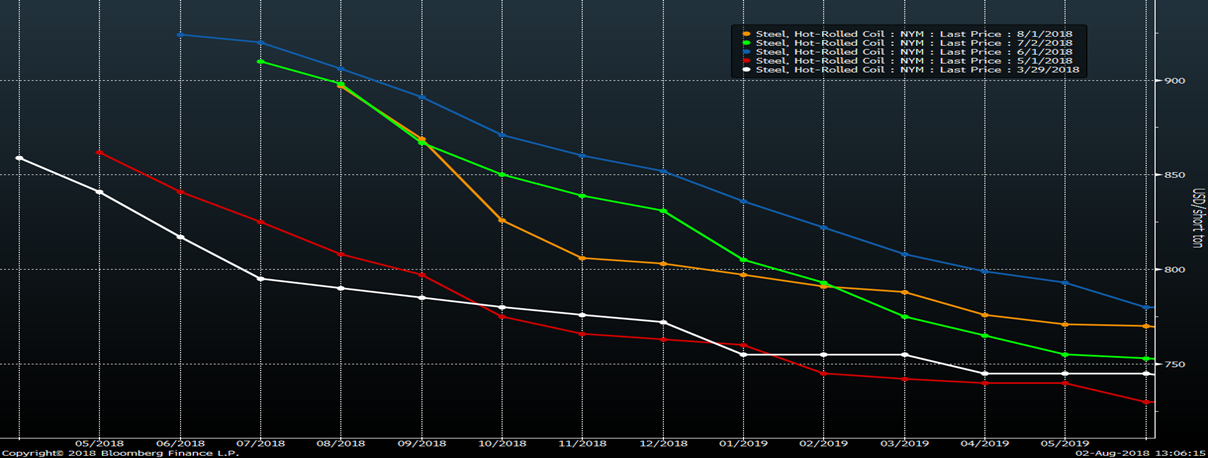
For those looking to hedge imported tons via the carry trade, the curve offers little safety. For instance, a purchase of imported HRC at a tariff adjusted price of $800/t to be delivered in November could be hedged in the futures market at only $810. The purpose of the carry trade is to minimize price risk during the time it takes for the material to arrive, but with futures in such steep backwardation, it does the opposite. Why? If nothing changes between now and November, the futures would rally to the index. July CME HRC futures settled at $915, which would result in a $105 loss on the November future hedge. The bottom line is any excess supply of imported steel via the carry trade is a no go. Supply constraint to continue.
The curve doesn’t offer much benefit for service centers hedging inventory price risk with service centers buying tons at current or lagged index prices, which are both north of $900. Even a discounted index deal puts purchases in the $875 area. So, service centers, like OEMs, continue to destock.
Word on the street is that a common OEM purchasing strategy has been to buy hand to mouth in anticipation of steep year-end discounts, but with service centers holding lean inventory and imports held at bay due to unattractive pricing and risk, it seems that the only supply solution will come from domestic steel mills heading into 2019 contract negotiation season.
However, for those OEMs that sell their products at fixed prices to their customers, there is a natural hedge to lock in profit margins. Sell your product at a known price, buy your materials at a known price. That’s a no brainer and the only obvious/attractive move to be made on the futures curve.
The winning trade all year has been to buy the backwardation in futures curve as prices have remained flat for months. This continued disconnect between the physical market and the futures curve has been curious and has diverged even further this summer with August futures trading as low as $883 just last week.
September CME HRC Futures (orange) & Platts TSI Midwest HRC Index (white)
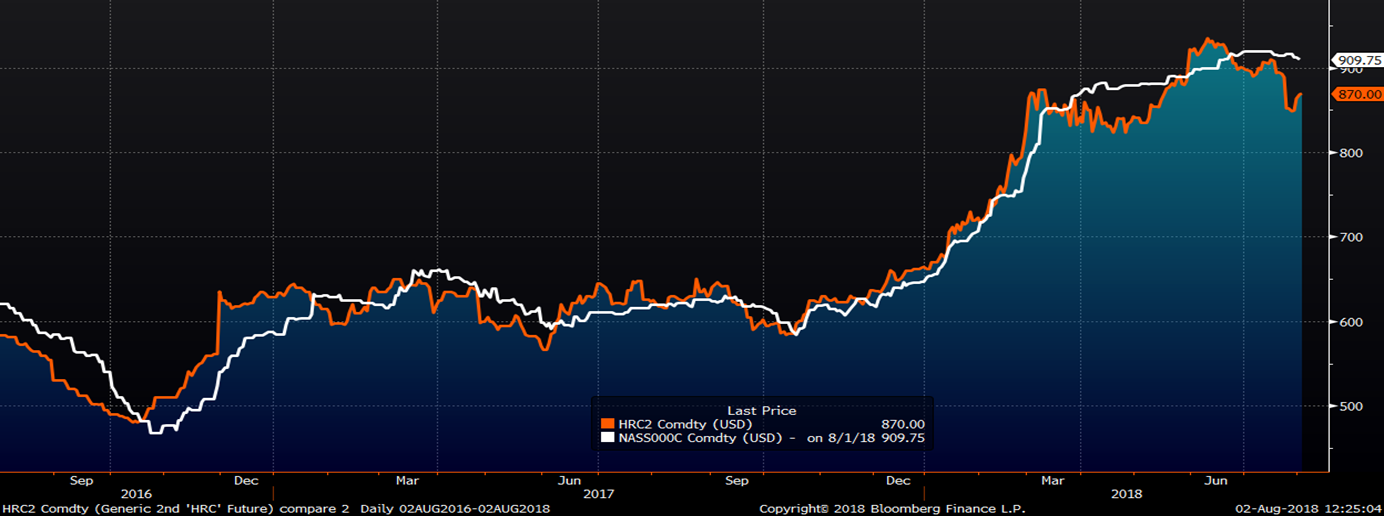
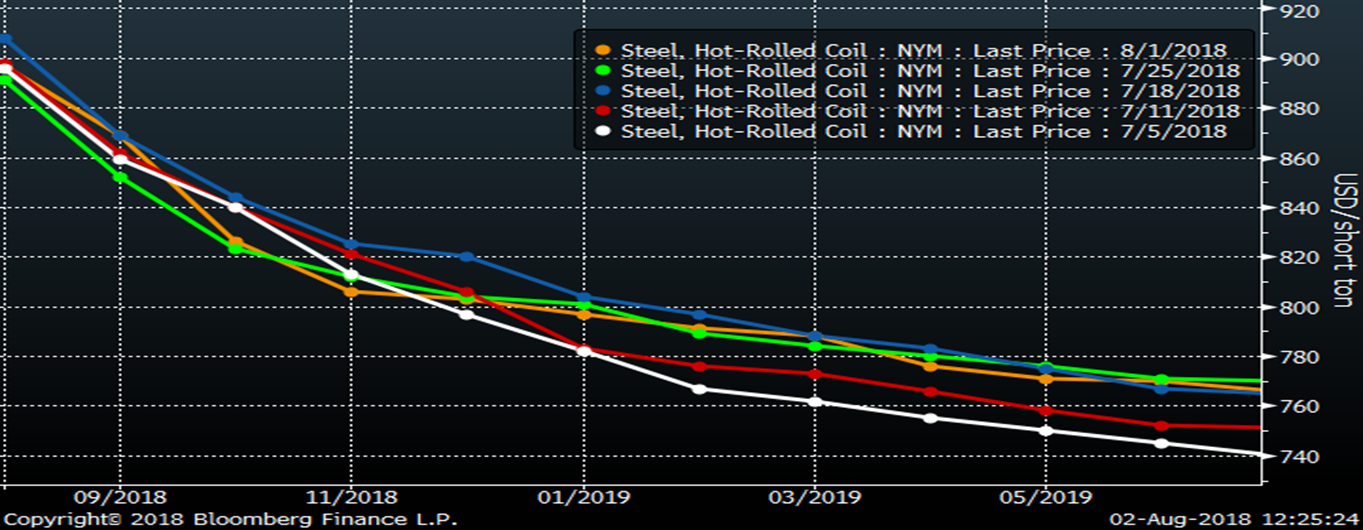
There are five index prints in August, but for the seller of that trade just to even break even, the last couple prints in August would have to be at least $50 below the current index. September futures are trading at $870 and October is trading at $830. To make a profit selling those futures, a whole lot has to happen in a very short time. Of course, anything is possible in the U.S. steel market, but with such lean inventory levels, a strong economy and an explicity protective government policy, its hard to see where the supply comes from to make prices plummet. It would seem a sharp drop in demand would have to be the catalyst to drive prices lower in the next 60-90 days.
CME Midwest HRC Futures Curve
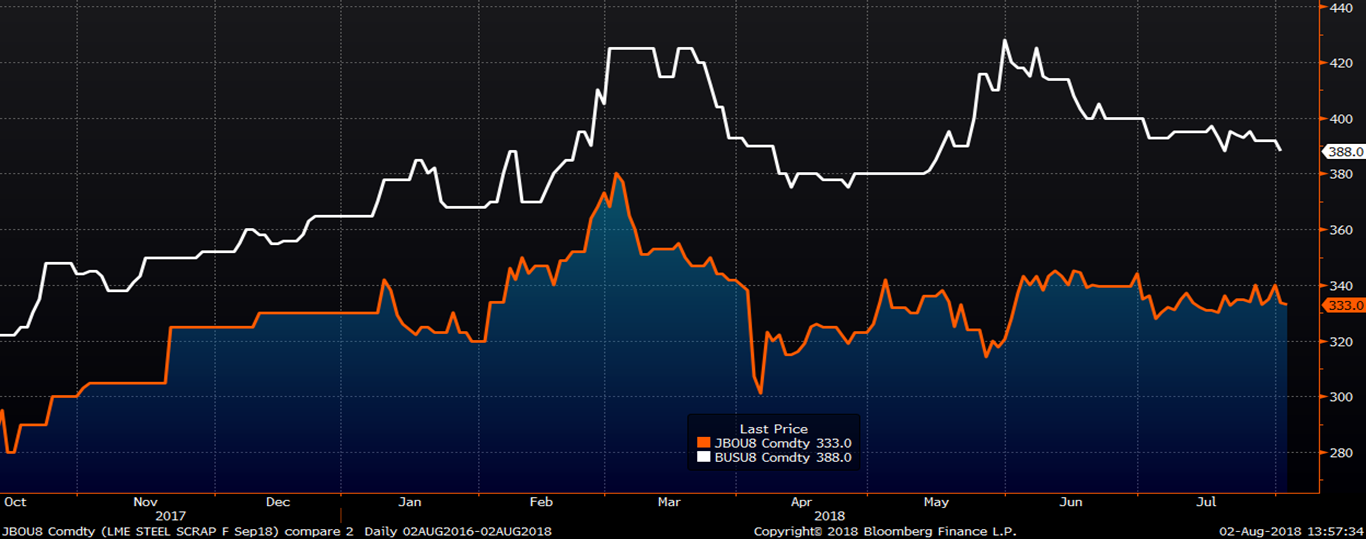
September LME Turkish scrap futures traded lower to $333/t today, remaining rangebound since May between $330-$345/t. September CME busheling futures also traded lower today to $388/lt, down from as high as $428/lt on May 31.
September LME Turkish Scrap and CME Busheling Futures
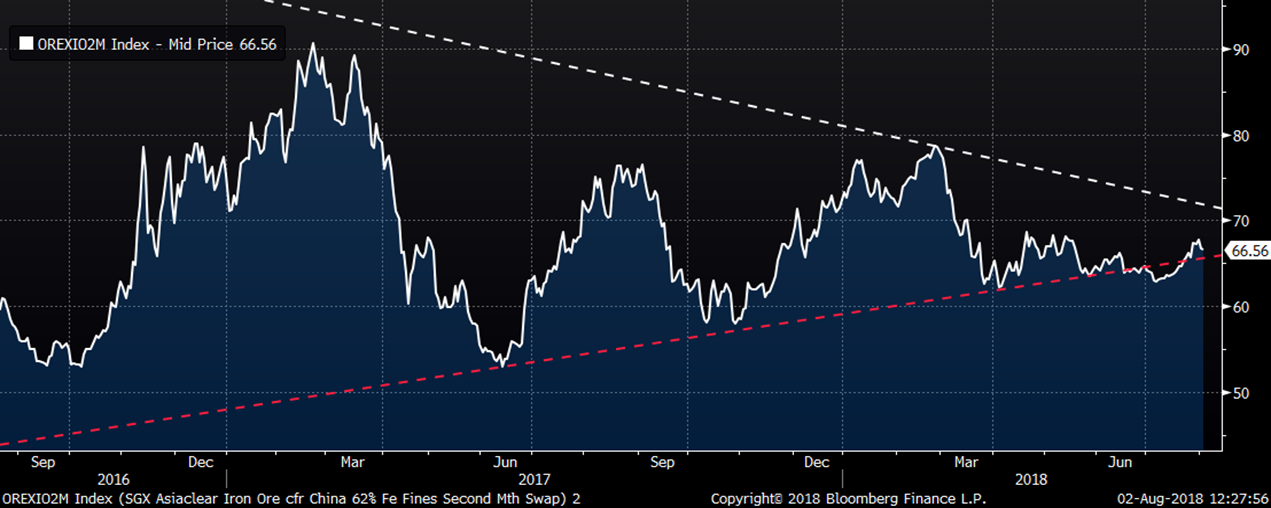
Iron ore futures had broken below a long-term down trend and looked set for a sharp correction, but the sell-off failed and the 2nd month future rallied back into the triangle.
2nd Month SGX Iron Ore Futures
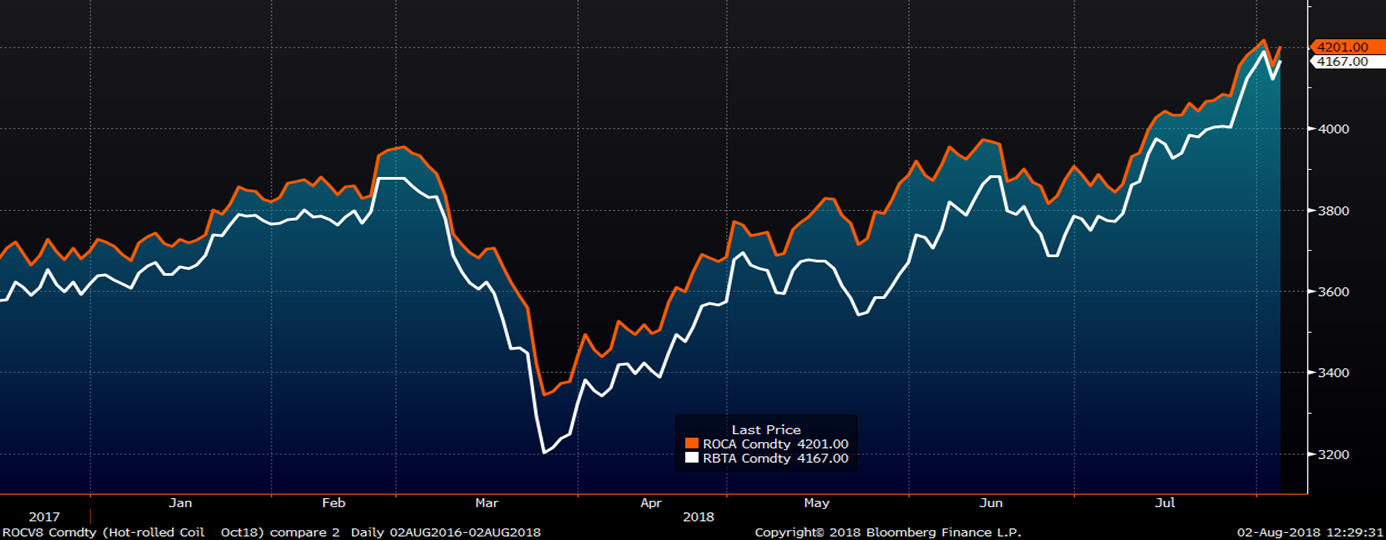
Look no further than the continued rally in Chinese finished steel futures for the culprit. In dollar terms, the October Chinese HRC future rebounded from a low of $579/t on July 6 to has high as $618/t yesterday before settling today at $607.
Chinese HRC (orange) and Rebar (white) Futures
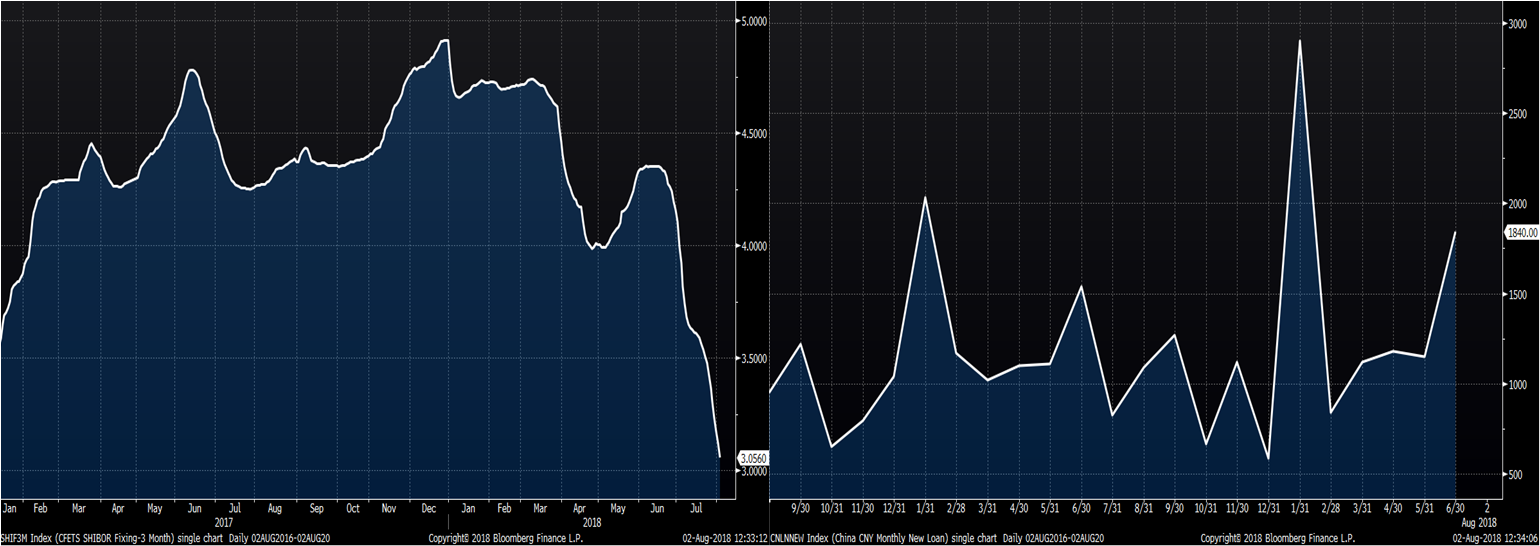
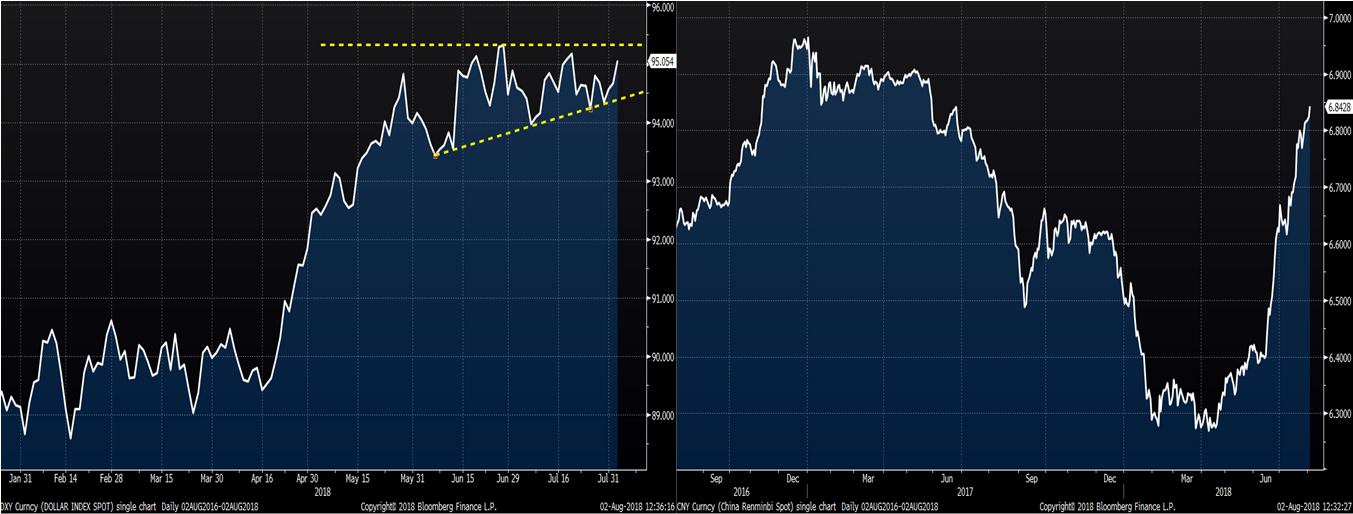
China’s response to U.S. tariffs and threats of more tariffs has been to devalue the yuan, lower short-term interest rates and stimulate the economy.
U.S. Dollar Index (left) & Chinese Yuan (right)
Historically, this combination of Chinese government actions resulted in increased development and steel demand. If this is the case, expect global prices to move higher in the coming months.
Chinese 3 Month Interest Rate (left) & Chinese New Yuan Loans (right)
