Market Data

July 16, 2018
SMU Currency Analysis: World Currency Markets in Turmoil
Written by Peter Wright
In the last months, 14 of the 16 currencies that Steel Market Update tracks were down against the dollar, led by Turkey down by 29.4 percent, and Russia and South Africa both down by 8.5 percent. The Chinese yuan has declined by 7.9 percent in the last three months. Please see the end of this report for an explanation of data sources.
The Fed kept its benchmark interest rate unchanged in July, but is widely expected to hike it again in September. MarketsNow had this to say on Aug 9: “The narrative driving the buck today is based on diverging rate hike expectations. As the U.S. Federal Reserve contends with accelerating growth, inflation and wage costs, the institution is expected to keep hiking rates. Growth and inflation are decelerating in most major regions outside the United States and for these reasons other central banks such as the European Central Bank, the Bank of Japan and the Reserve Bank of Australia are unable to hike rates. Given the growing divergence between the U.S. and other parts of the world, the U.S. dollar is rallying accordingly.”
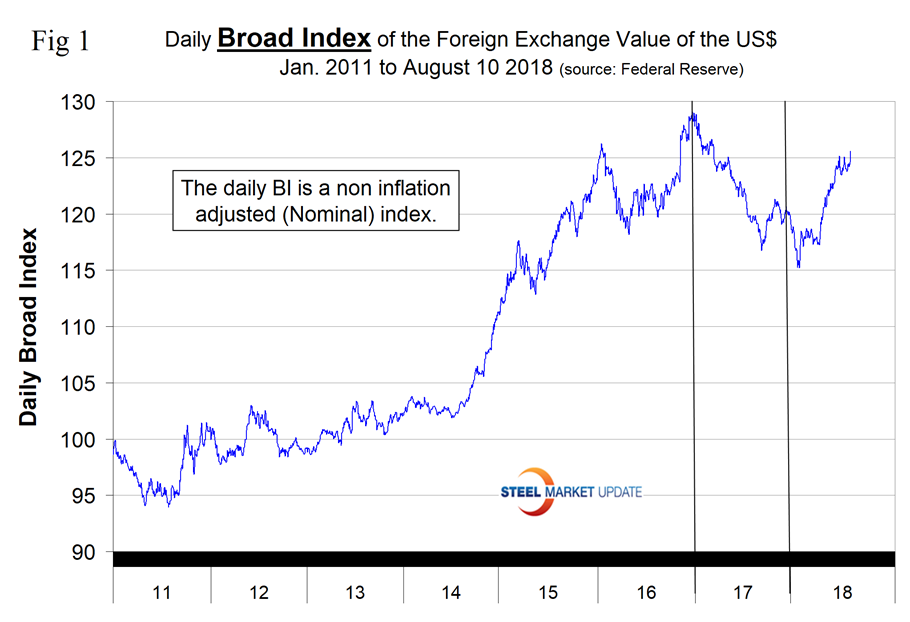
The Broad Index value of the U.S. dollar is reported several days in arrears by the Federal Reserve; the latest value published was for Aug. 10. Figure 1 shows the index value since January 2011. The dollar had a recent peak of 128.96 on Jan. 3, 2017, which was the highest value in almost 15 years; the recent low point was the Feb. 1, 2018, at 115.21. On Aug. 10, the dollar had recovered to 125.58, which was the highest value since March 15 last year.
Each month, SMU publishes an update of Table 1, which shows the value of the U.S. dollar against the currencies of 16 major global steel and iron ore trading nations. The table shows the change in value in one year, three months, one month and seven days through Aug. 13. Currencies that weakened against the U.S. dollar are color coded in red. Green indicates currencies that strengthened against the U.S. dollar.
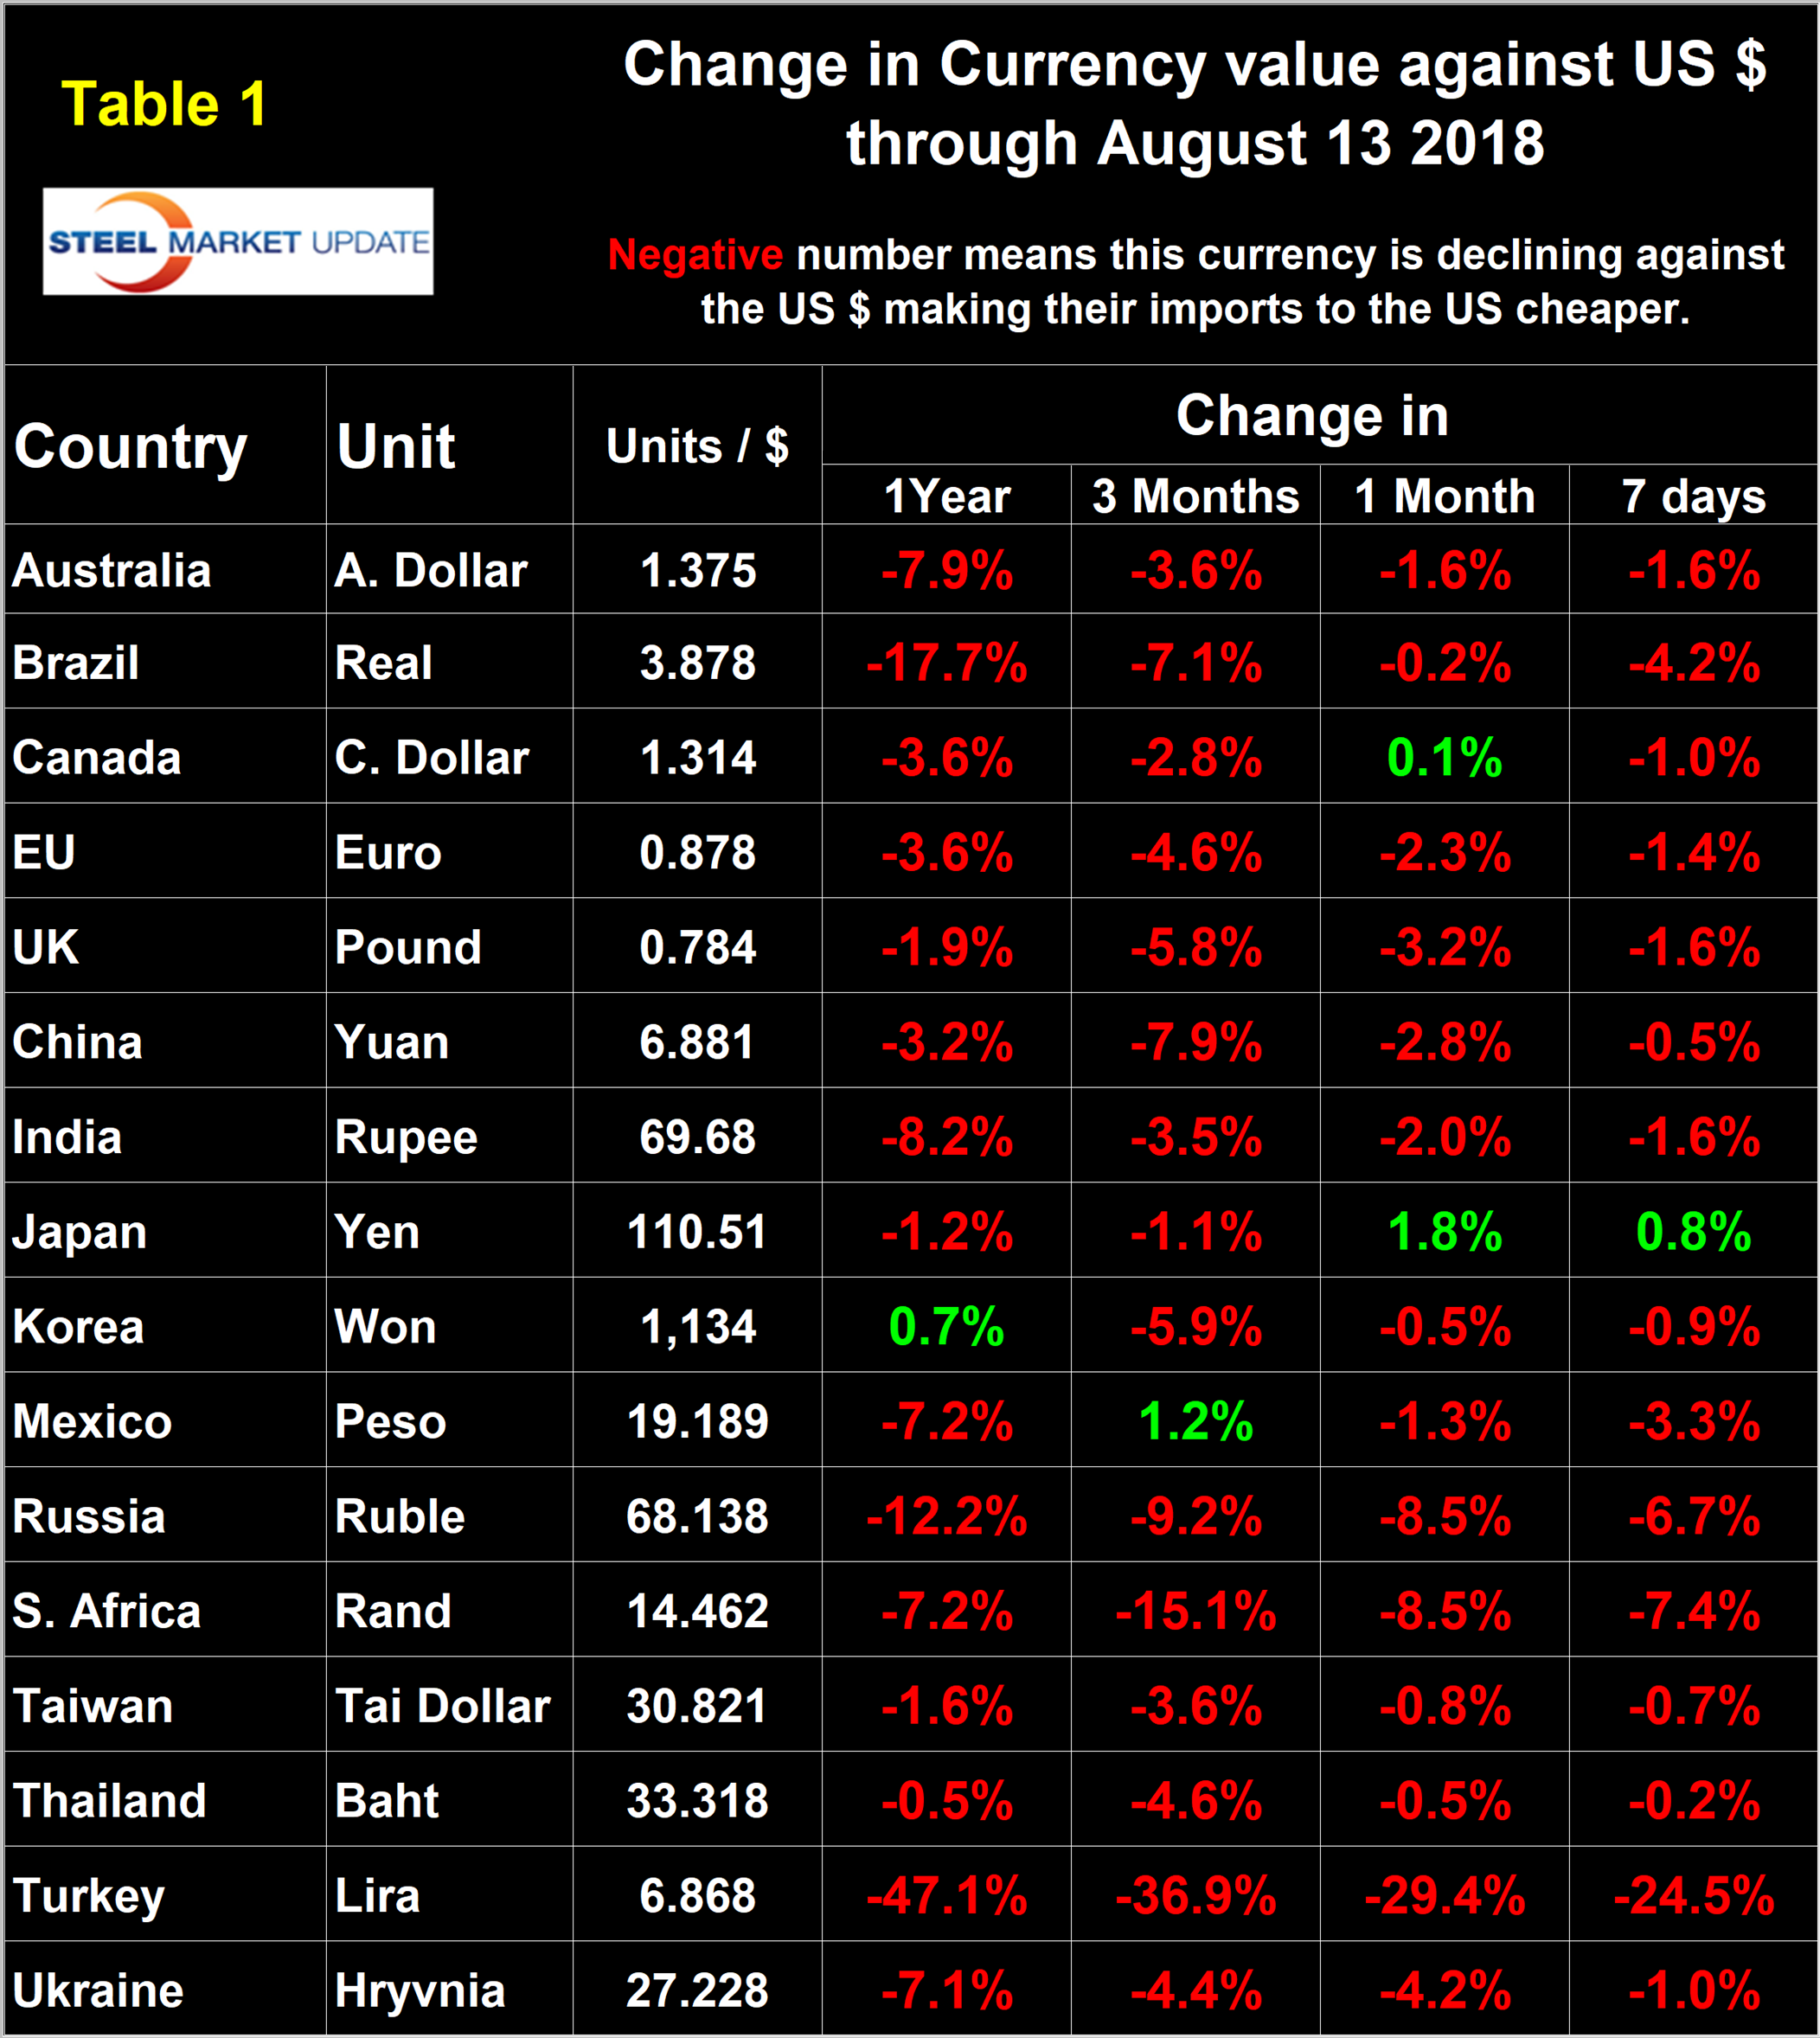
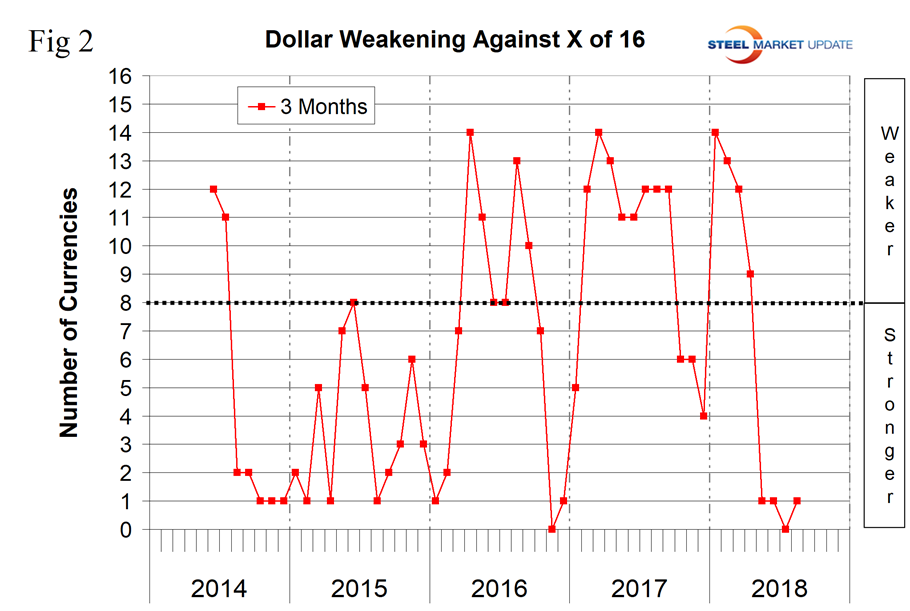
Figure 2 gives a longer-range perspective and shows the extreme gyrations that have occurred in the last three years. The dollar strengthened against every one of the 16 currencies in the three months through July 14 and against 14 in three months through Aug. 13. Sometimes the change in value of these 16 currencies does not accord with the broad index, but this is not one of those times.
A rising dollar puts downward pressure on commodity prices that are greenback denominated. We regard strengthening of the U.S. dollar as negative and weakening as positive because of the effect on the trade balance of all commodities and on the total national trade deficit.
In each of these reports, we comment on several of the 16 steel and iron ore trading currencies listed in Table 1 and over a period of several months will describe the history of all of them. Charts for each of the 16 currencies are available through Aug. 13 for any premium subscriber who requests them.
The most dramatic recent currency event is the decline of the Turkish lira, which was down by 45.5 percent in the six months since Feb. 14 and has been in freefall since mid-June.
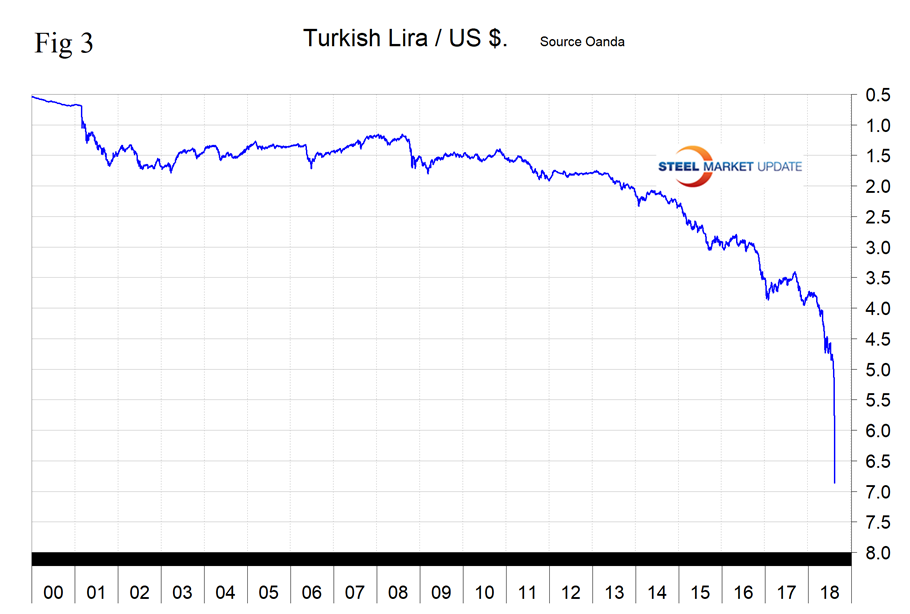
In the first half of 2018, Turkey was the eighth highest volume importer to the U.S. with a volume of 567,000 metric tons. Duties on Turkish steel imports to the U.S. were increased to 50 percent on Aug. 13. In three months through Aug. 13, the lira was down by 36.9 percent against the dollar, most of which (24.5 percent) occurred in the last seven days. On Aug. 12, Doug Noland, a portfolio strategist wrote: “Turkey’s crisis resembles previous bursting of emerging market bubbles: too much cheap international “hot money” financing an unsound boom, replete with excessive spending and malinvestment. Today, the Turkish ‘economic miracle,’ as many before it, is exposed in harsh terms. The reversal of speculative flows has illuminated latent fragilities and an unsound currency. The banking system and scores of corporate borrowers of dollar-denominated debt are at the brink of insolvency. Suddenly, the whole bubble is coming crashing down.”
Later the same day in what was perhaps the most unnerving declaration yet, Turkish President Recep Tayyip Erdogan said this: “I’m calling out to industrialists, do not attack banks to buy foreign currencies. It is industrialists’ duty, too, to keep this nation on its feet. Otherwise, we will set into motion our plan B and C.” That came across as a threat to seize foreign exchange deposits. There are roughly $161 billion in foreign currency deposits sitting in Turkish banking accounts belonging to corporations and individuals. Theoretically, Erdogan could seize those and forcibly convert them to lira at a rate of his choosing, Noland said.
The Canadian Dollar
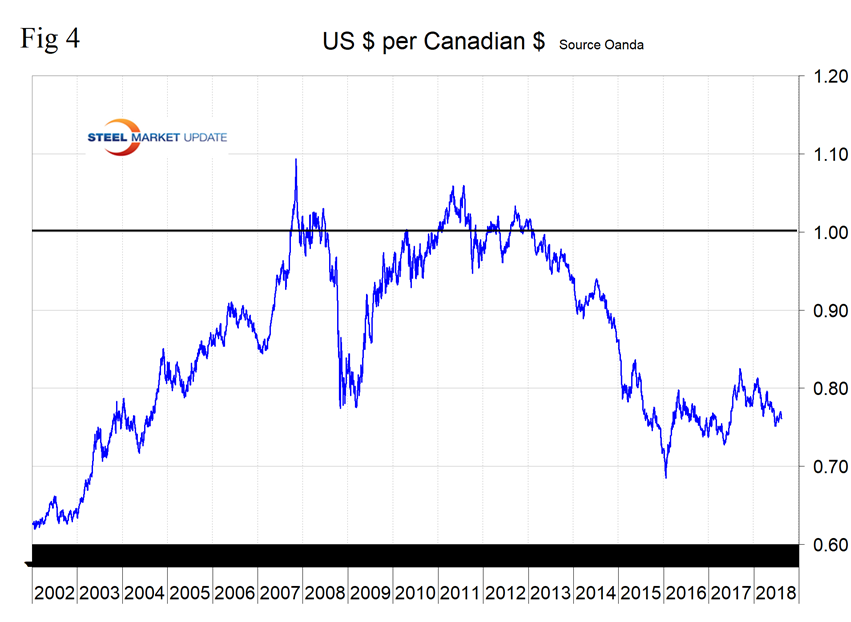
Canada’s dollar has declined by 2.8 percent in the last three months, but stabilized in the last 30 days. Canada is the largest volume steel importer to the U.S. with a total of 3.3 million metric tons in the first half of 2018. Last month, the IMF completed its executive board consultation with Canada and concluded as follows: “The outlook is subject to significant risks, both domestic and external. A key domestic risk is a sharp correction in the housing market. In this context, risks to financial stability and growth could emerge, if the house price correction is accompanied by a rise in unemployment and sharp contraction in private consumption. External risks are now more acute than in the past and stem from sources that can be mutually reinforcing—including the impact of U.S. tax reform on Canada’s medium-term competitiveness, uncertainty related to NAFTA negotiations, and the prospect of further escalation in trade tensions. Policy choices will be crucial in shaping the outlook and mitigating risks.”
The Australian Dollar
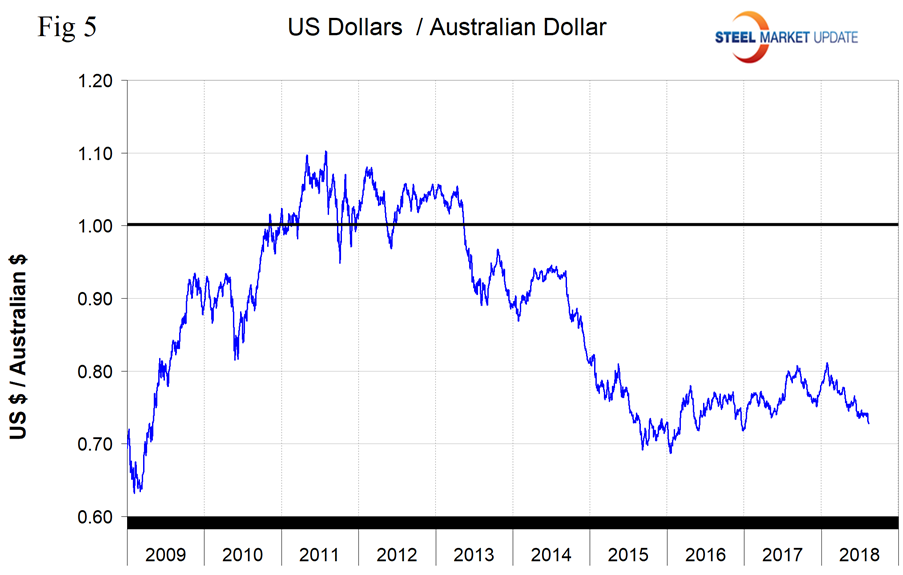
Australia’s dollar has weakened by 3.6 percent in three months and by 1.6 percent in one month. Australia shipped 122,000 tons into the U.S. in first-half 2018, which puts them far down the list on the volume table, but we include them in the 16 because of their dominance of the global iron ore market. On Aug. 9, Invesco U.S. wrote: “The Australian dollar has struggled recently on the back of slower Chinese growth and increased tariff escalation between the U.S. and China. Slower Chinese growth has pushed metal commodity prices lower, increasing interest in short Australian dollar positions. Slower housing growth combined with over-extended consumers are also weighing on the currency. With no end in sight for trade disputes, we currently do not see any upside to the Australian dollar.”
The Mexican Peso
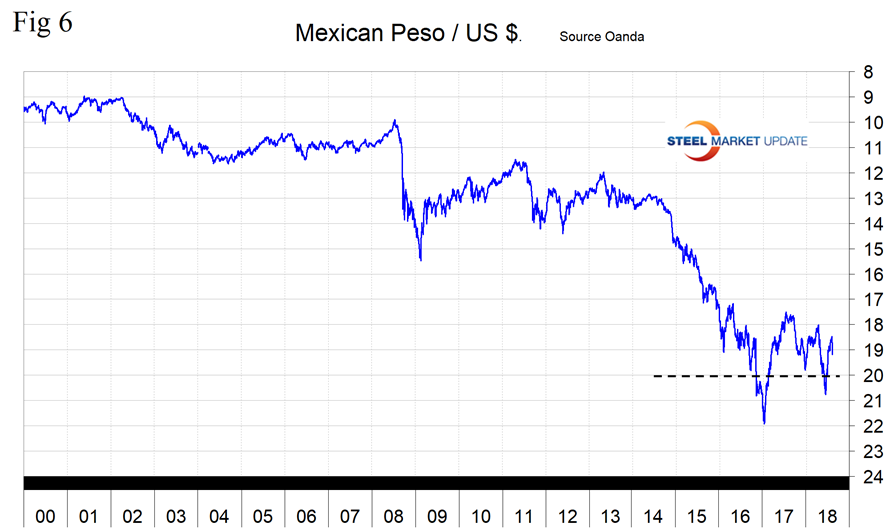
Mexico’s peso was the only currency of the 16 to hold its own against the dollar in the last three months with an increase in value of 1.2 percent. This is a case of speaking too soon because the peso was down by 3.3 percent in the seven days leading up to Aug. 13. In the first half of 2018, Mexico was the third highest volume steel exporter to the U.S. after Canada and Brazil with a total of 1.8 million metric tons.
The Russian Ruble
Russia’s ruble has declined by 9.3 percent in three months and by 8.5 percent in one month. Russia was the fifth highest volume importer of steel into the U.S. in first-half 2018 with a total volume of 1.2 million metric tons. On Aug. 8, currency analyst Dean Popplewell wrote: “The ruble is testing its two-year low following the U.S. State Department announcement on Russian sanctions related to a chemical agent being used in a UK spy attack last March.”
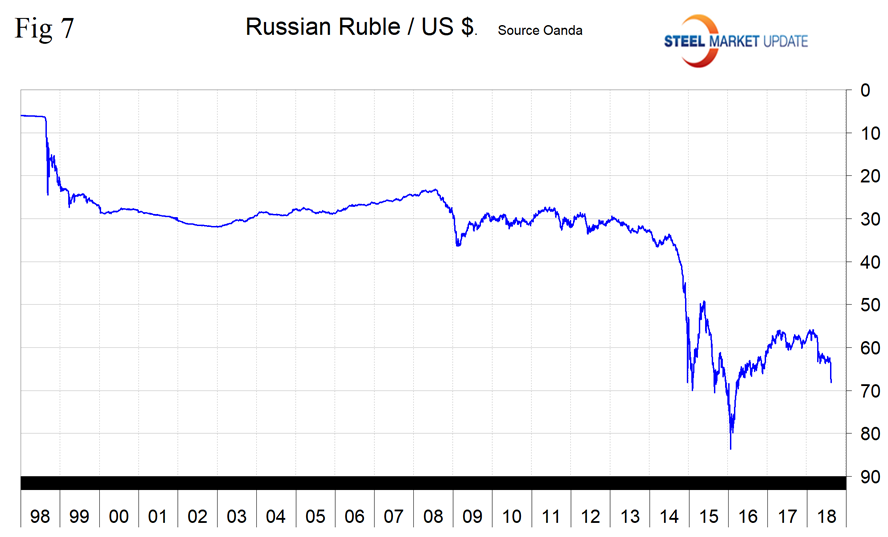
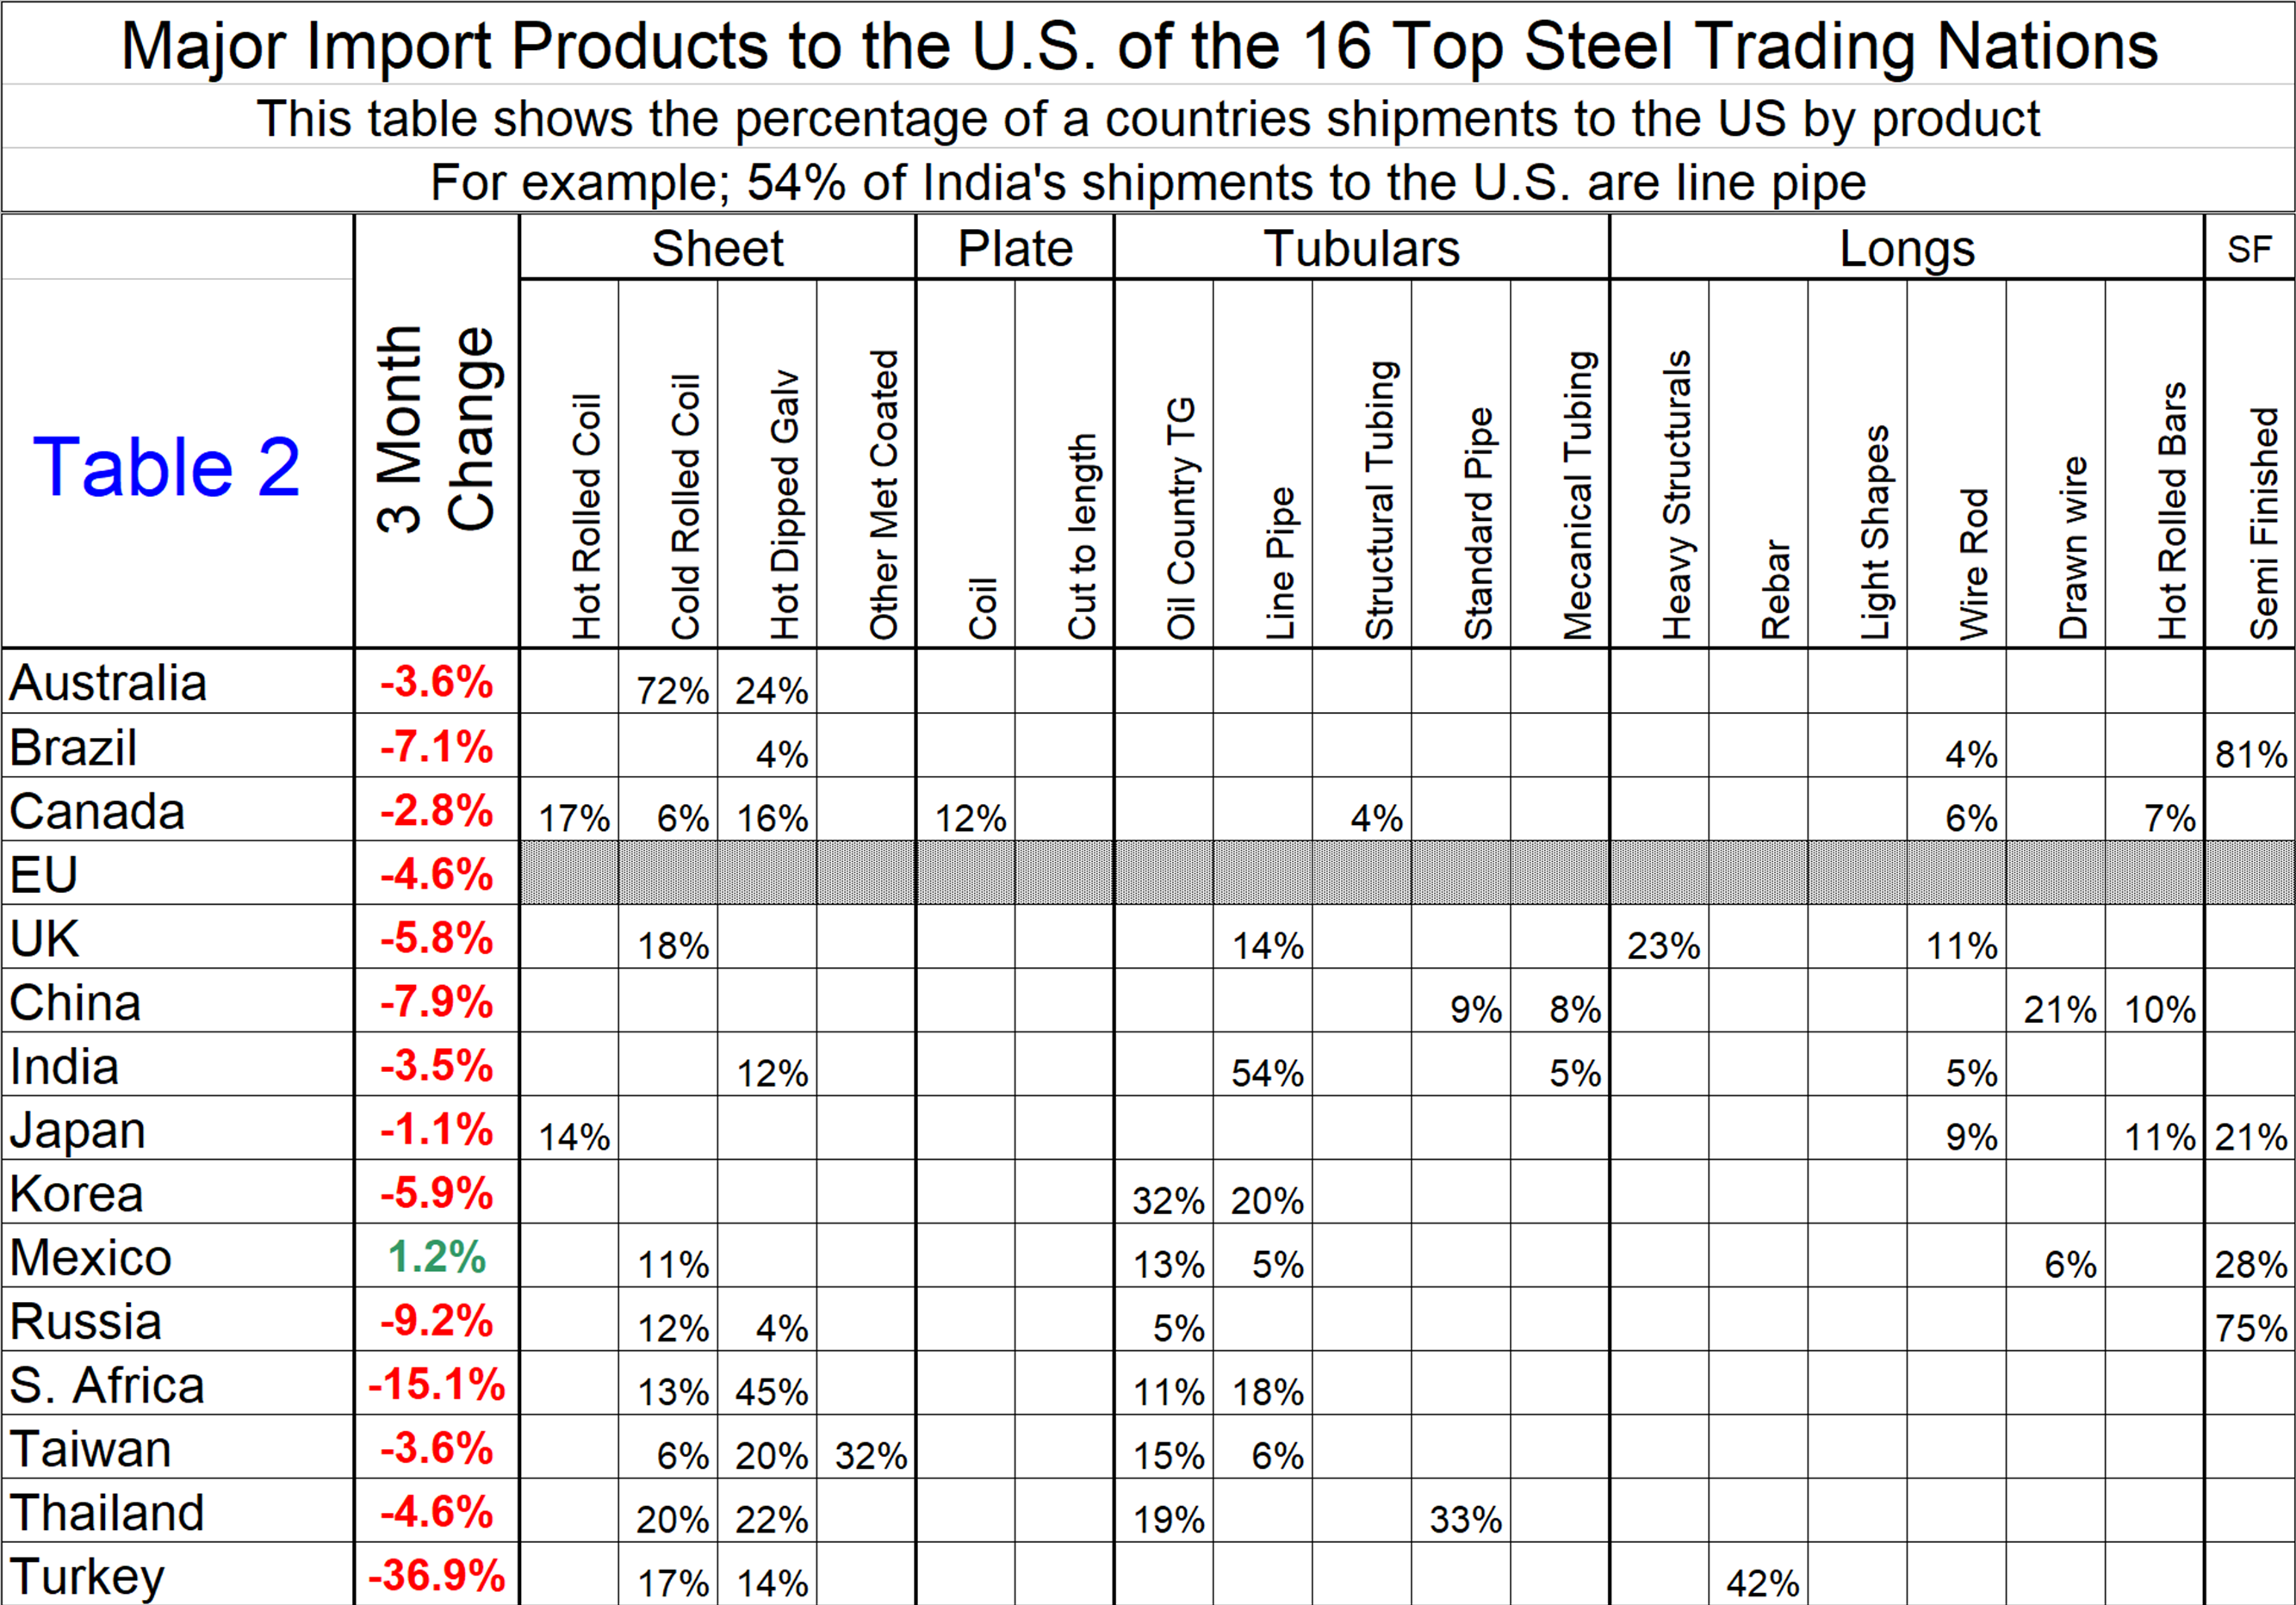
Table 2 is an exhibit that we introduced three months ago to show which are the major products in the portfolio of the 16 nations and the three-month change in currency value. Our intent was to show which nations were worth considering for particular products based on their recent currency trajectory. At the present time, we think this is not useful because of currency volatility and the unpredictable tariff situation, but we will leave it in this piece because it does show the relative volumes by steel product.
Explanation of Data Sources: The broad index is published by the Federal Reserve on both a daily and monthly basis. It is a weighted average of the foreign exchange values of the U.S. dollar against the currencies of a large group of major U.S. trading partners. The index weights, which change over time, are derived from U.S. export shares and from U.S. and foreign import shares. The data are noon buying rates in New York for cable transfers payable in the listed currencies. At SMU, we use the historical exchange rates published in the Oanda Forex trading platform to track the currency value of the U.S. dollar against that of 16 steel and iron ore trading nations. Oanda operates within the guidelines of six major regulatory authorities around the world and provides access to over 70 currency pairs. Approximately $4 trillion U.S. dollars are traded every day on foreign exchange markets.


