Prices

March 15, 2018
Midwest HRC Futures – Buyer Strike in Super Volatile Market
Written by David Feldstein
The following article on the hot rolled coil (HRC) futures market was written by David Feldstein. As the Flack Global Metals Director of Risk Management, Dave is an active participant in the hot rolled futures market, and we believe he provides insightful commentary and trading ideas to our readers. Besides writing futures articles for Steel Market Update, Dave produces articles that our readers may find interesting under the heading “The Feldstein” on the Flack Global Metals website, www.FlackGlobalMetals.com. Note that Steel Market Update does not take any positions on HRC or scrap trading and any recommendations made by David Feldstein are his opinions and not those of SMU. We recommend that anyone interested in trading HRC or scrap futures enlist the help of a licensed broker or bank.
Was last Wednesday the Gary Cohn top for HRC futures???
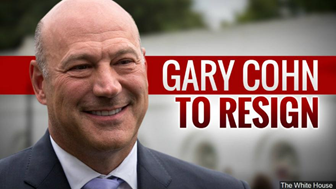
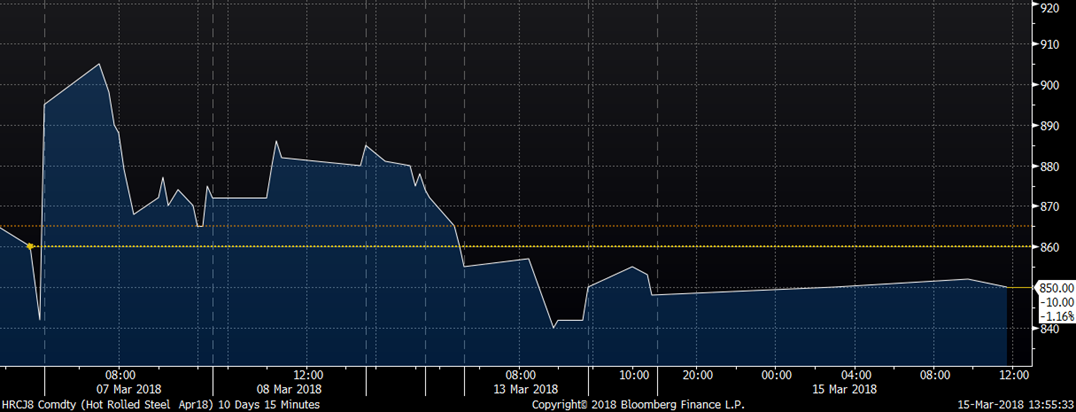
Gary Cohn’s resignation after the close of business Tuesday March 6 signaled President Trump’s threat to implement tariffs on steel and aluminum imports was going to become reality. Early last Wednesday morning, Midwest HRC futures traded up $40-$50 in response, with the April future trading above $900/st. Later that morning, U.S. Steel announced plans to reopen Granite City Works, and futures traded right back down to as low as $865. This type of “tape” can be indicative of a “blow-off top.” If you are a bull, you’d like to see the April future trade back above $900. Word on the street is there are late May spot tons being offered at $900/st, so it is entirely possible the rally resumes. Fading this rally has been treacherous thus far! The one solid bet on the board is that futures will remain super volatile!
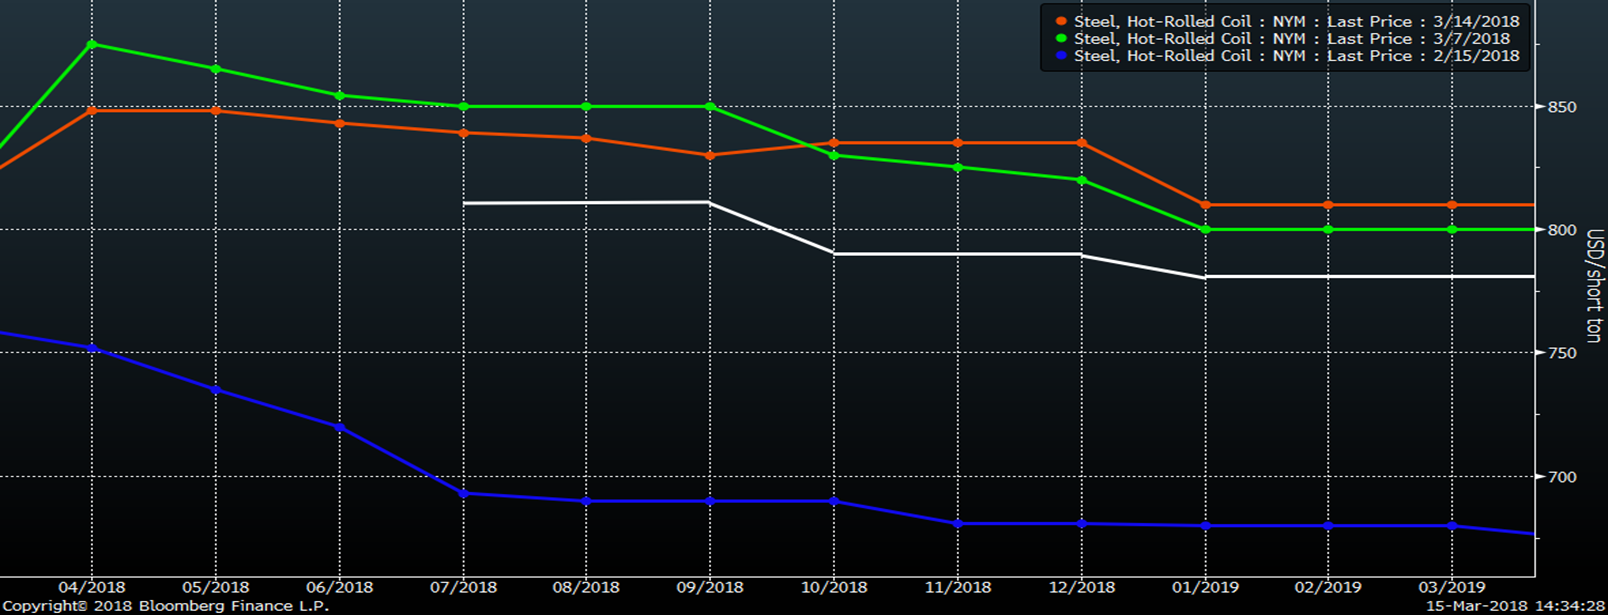
Despite this week’s sharp move higher in the CRU Index, HRC futures have remained under pressure. This chart shows the CME Midwest HRC futures curve on Feb. 15 (blue), the day before the 232 announcement, March 8 (green) and March 14 (orange). Futures moved $100 – $150 higher in response to the 232, but the back half of 2018 has been under pressure this week as buyers have been difficult to locate. Today, the second half of 2018 was offered as low as $810/st with no buy side interest. The white line is a best guess at where the curve settles tonight showing the abrupt move lower in second half futures.
CME Midwest HRC Future Curve
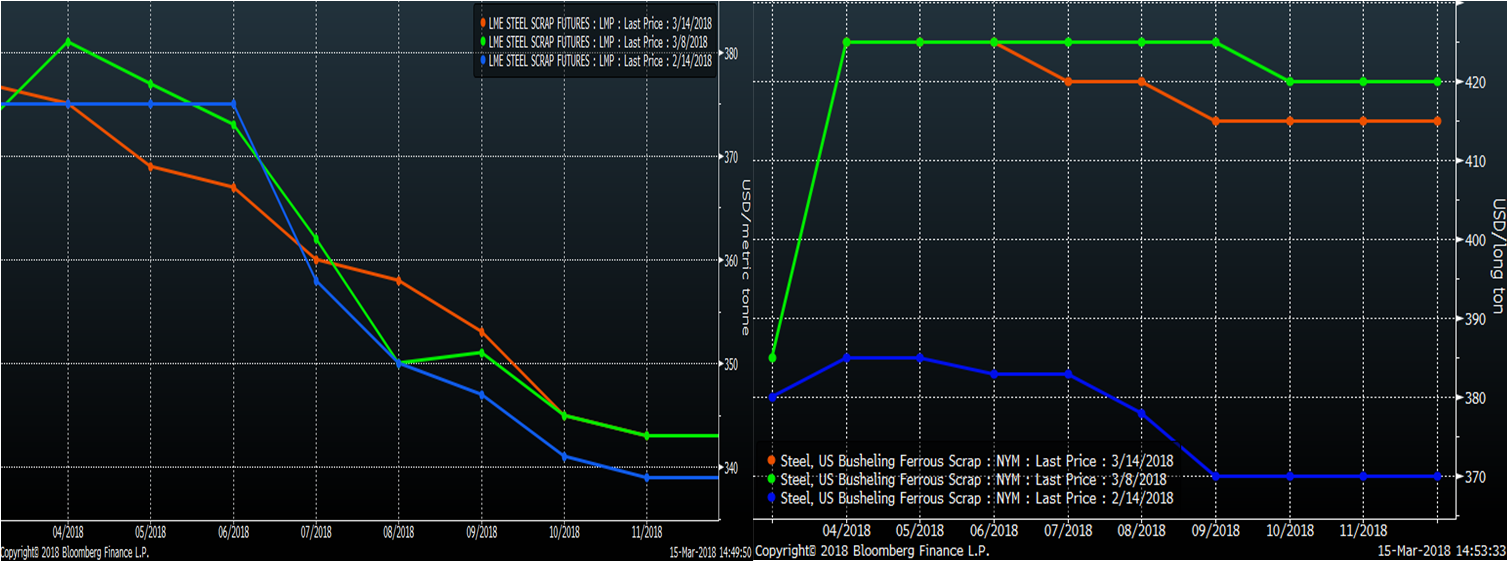
There has been small pressure on scrap futures, which have traded around $5 lower in the past week. Turkish scrap futures have been range bound over the past month, while busheling futures jumped $35 – $50 following the 232 announcement.
LME Turkish Scrap Futures & CME No. 1 Busheling Curves
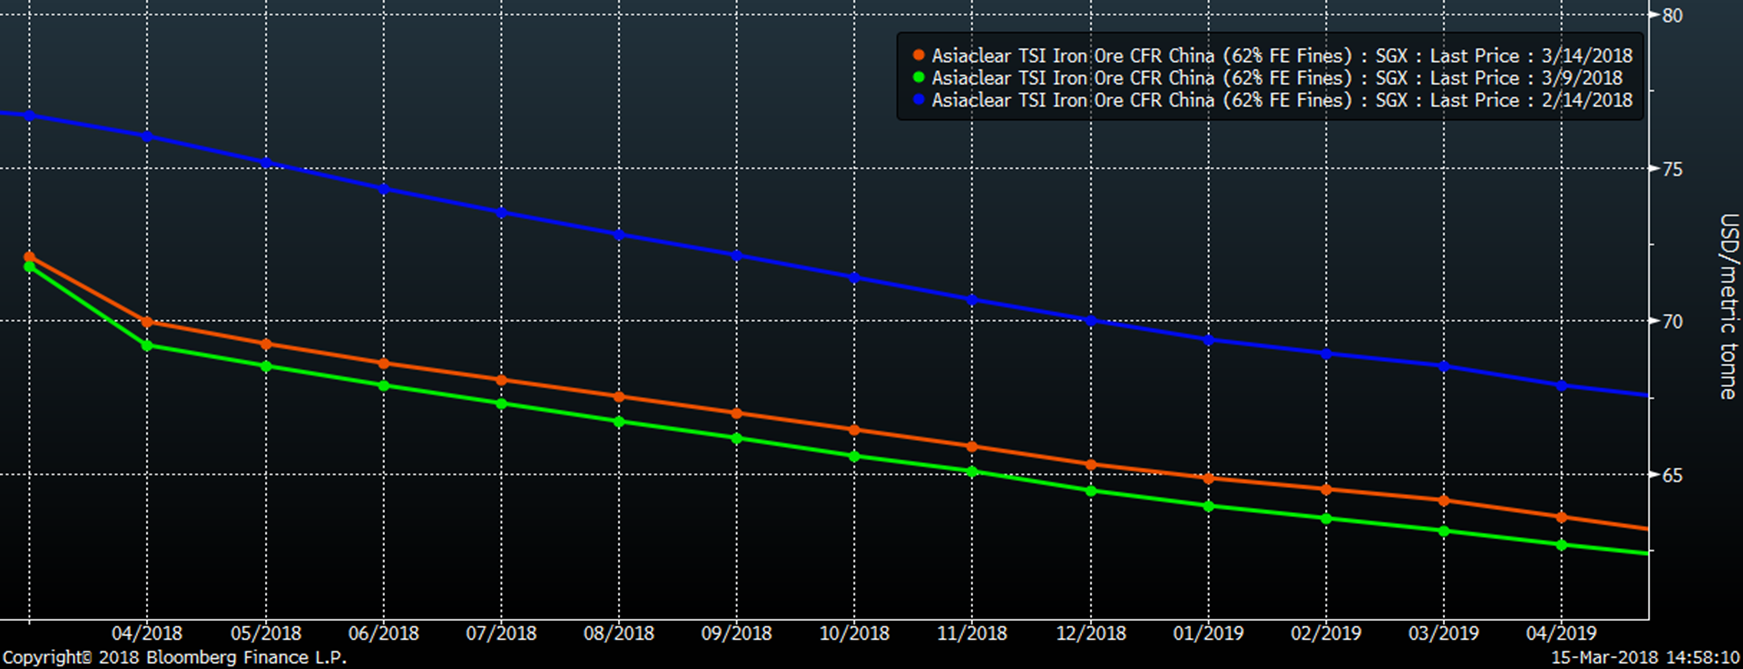
Iron ore futures have been under pressure after a steep 9 percent drop last week with iron ore and finished steel inventories seeing massive restocking increases over the past few weeks.
SGX Iron Ore Future Curve
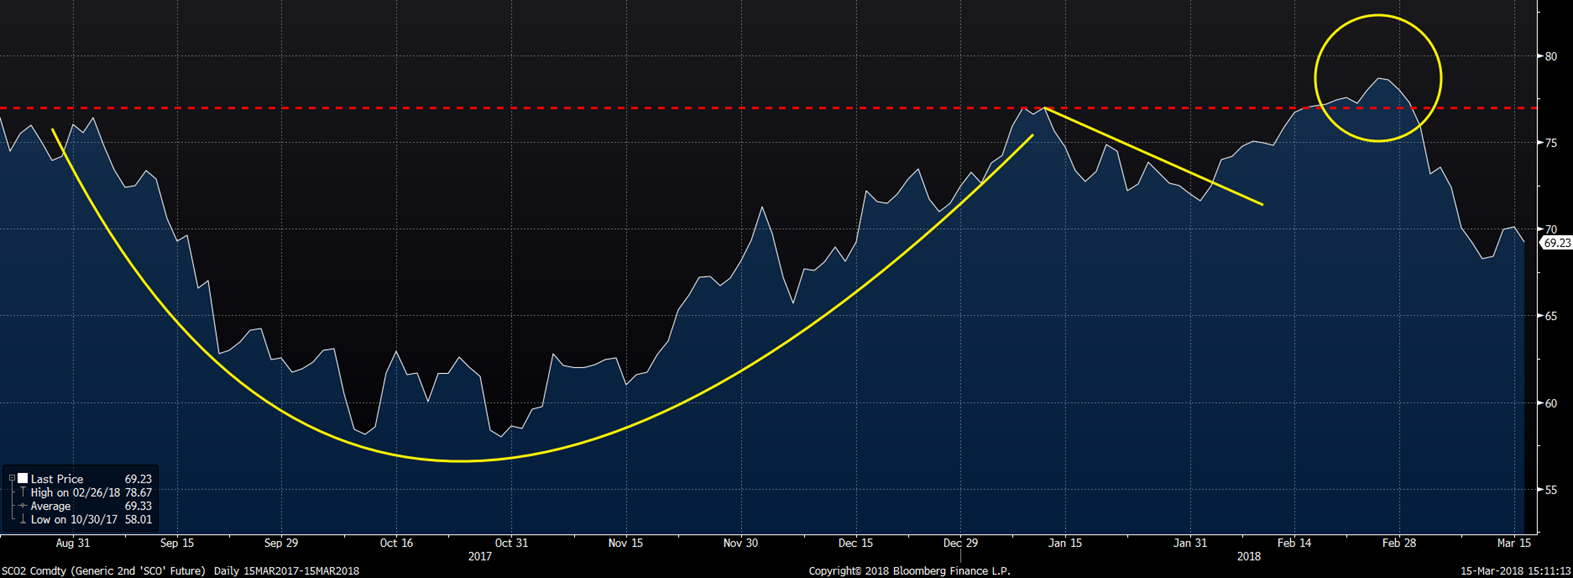
We had been getting technical with a “cup and handle” pattern in iron ore. Ore prices peeked above the top level and then failed miserably. Not a good sign for iron ore prices.
SGX 2nd Month Iron Ore Future
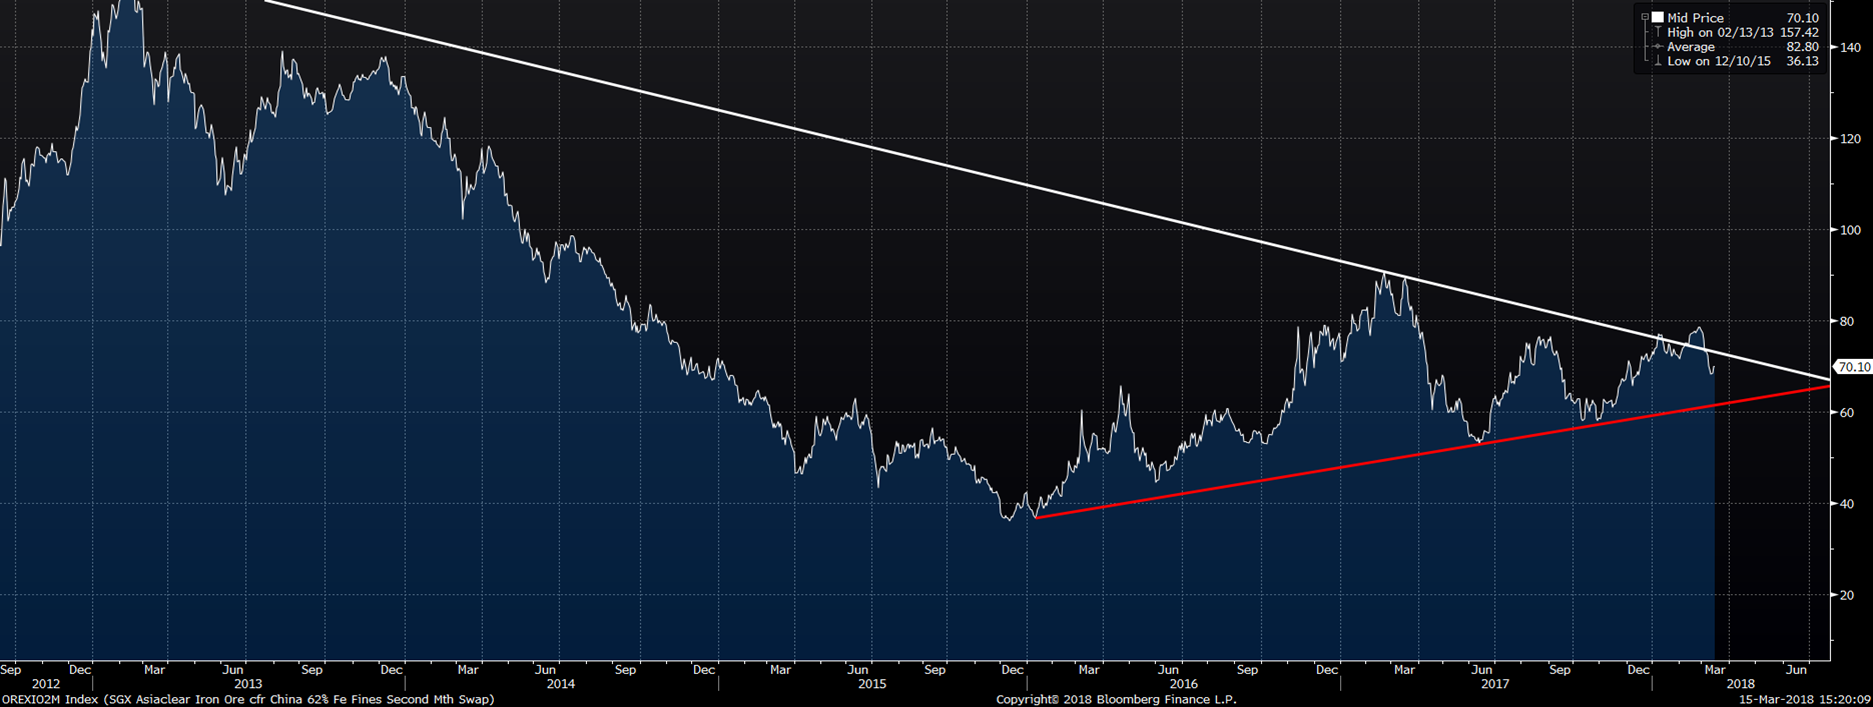
Taking a longer look at the 2nd month iron ore future, the price level in the chart above had both short- and long-term implications if it started to break higher. Below is a longer term chart with a six-year down trendline. Since iron ore prices peeked above this trendline and then failed, the next point of interest is to watch the red uptrend line. If ore breaks below that line, i.e. below $60, there might be another big selloff coming in the iron ore price.


