

Market Data

June 1, 2017
Key Market Indicators through May 31, 2017
Written by Peter Wright
An explanation of the Key Indicators concept is given at the end of this piece for those readers who are unfamiliar with it. This will explain the difference between our view of the present situation which is subjective and our analysis of trends which is based on the latest facts available. We now have three consecutive months with a great present situation assessment. In May 50 percent of our indicators were positive by historical standards. This was the best result since we began this analysis in January 2010. However there was a deterioration in trends in May.
![]() The total number of indicators considered in this analysis is 36.
The total number of indicators considered in this analysis is 36.
Please refer to Table 1 for the view of the present situation and the quantitative measure of trends. Readers should regard the color codes in the present situation column as a quick look at the current market condition. The “Trend” columns of Table 1 are also color coded to give a quick visual appreciation of the direction in which the market is headed. All data included in this table was released in May, the month or specific date to which the data refers is shown in the second column from the far right and all data is the latest available as of May 31st, 2017.
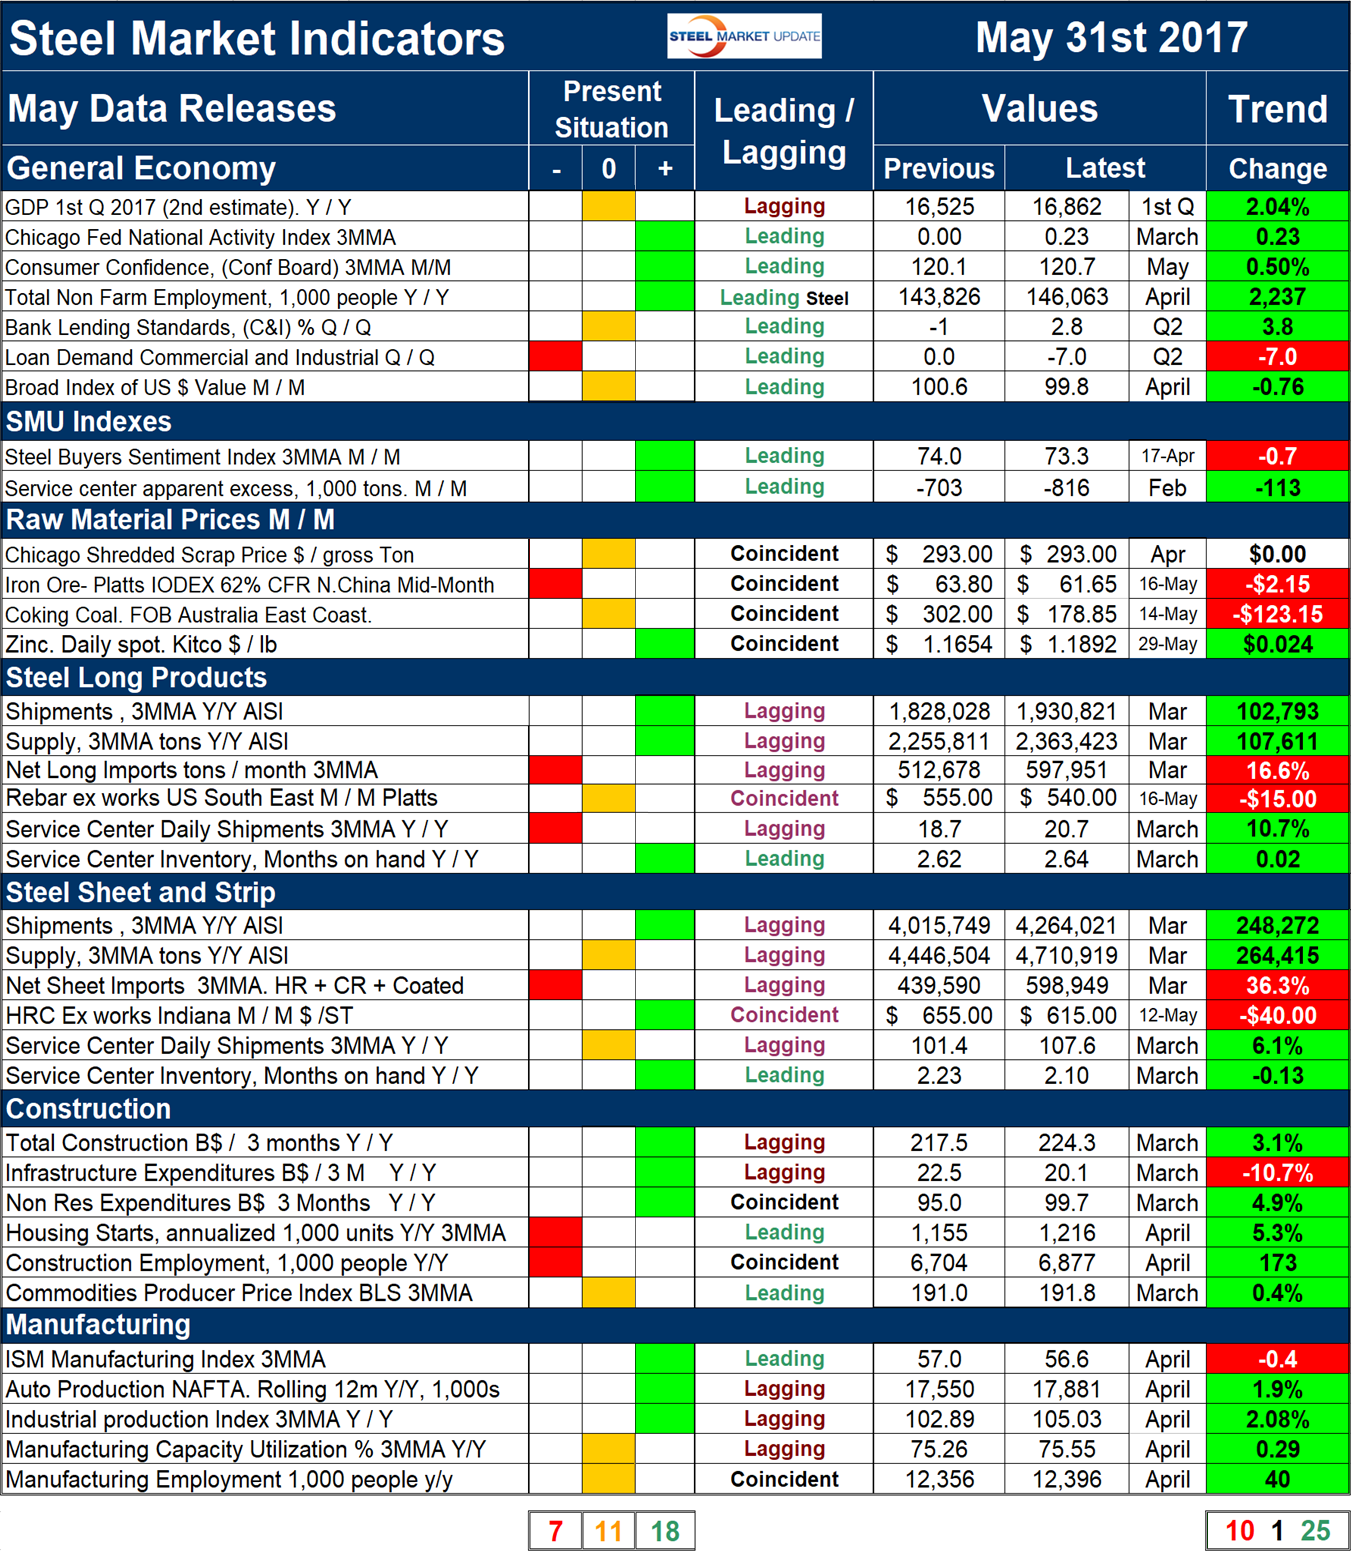
Present Situation
There was a net increase of two indicators that we consider to be positive in May, a decrease of two neutrals and no change in the number of negatives. We currently view 18 of the 36 indicators as positive, 11 as neutral and 7 as negative. Our intent in using the word neutral is to say that this indicator is considered to be in the mid-range of historical data. The changes this month were as follows. The Chicago Fed National Activity Index had a reading > 0.2 in May which we regard as positive. Demand for commercial and industrial loans as reported in the Federal Reserve Senior Loan Officer Survey entered negative territory. The broad index value of the US $ on international exchange markets fell below 100 which we regard as positive. In the raw materials section the price of coking coal came off its cyclone driven peak and returned to a neutral position. There were no changes in the present situation of the long products market. In the sheet market total mill shipments moved into the positive category. There were no changes to our perception of either the construction or manufacturing indicators. Figure 1 shows our monthly assessment of the present situation since January 2010 on a percentage basis.
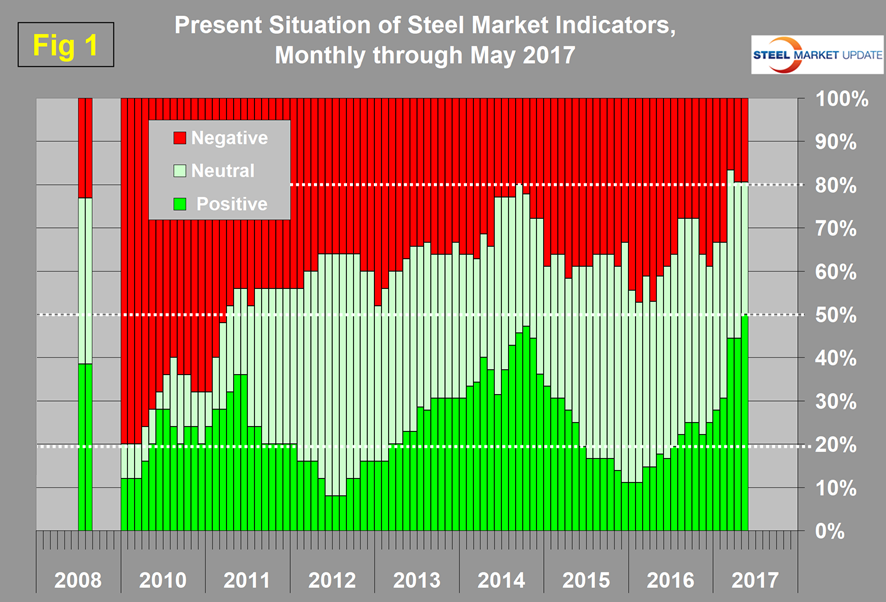
The number of indicators classified as positive peaked at 47.2 percent in October 2014 and steadily declined to 11.1 percent in the three months through January 2016. Since February 2016 there was a steady increase in the number of indicators that we consider to be positive which reached 50.0 percent at the end of May 2017. The combination of positive and neutral indicators at the end of March was the highest ever at 83.3 percent.
Trends
Most values in the trends columns are three month moving averages to smooth out what can be very erratic monthly data. Trend changes in the individual sectors since the end of April are described below together with some general comments. (Please note in most cases this is not May data but data that was released in May for previous months.)
In the four months October through January there was a steady improvement in trends followed by a surge in February that was sustained in March and April with a decline in May. Figure 2 shows the trend of the trends and the pre-recession situation at the far left of the chart.
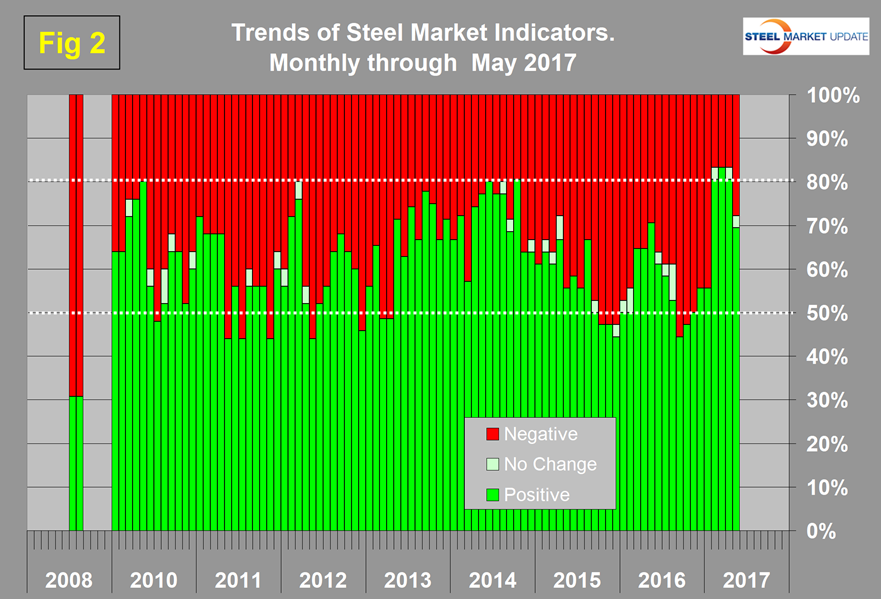
The proportion of indicators trending positive through May 31st was 69.4 percent down from 80.6 percent at the end of April which followed March at 83.3 percent, the best result since our data was first compiled. In the General Economy section, the only indicator that trended negative in May was loan demand for commercial and industrial transactions. The headline report of GDP growth in Q1 came in at an upwardly revised 1.2 percent last week. On a y/y basis which we report in Table 1, GDP was up by 2.04 percent which was close to the 2.08 percent average in 29 quarters since Q1 2010. Therefore we conclude that in recent quarters the growth of US GDP is in line with its average for the last sixteen years.
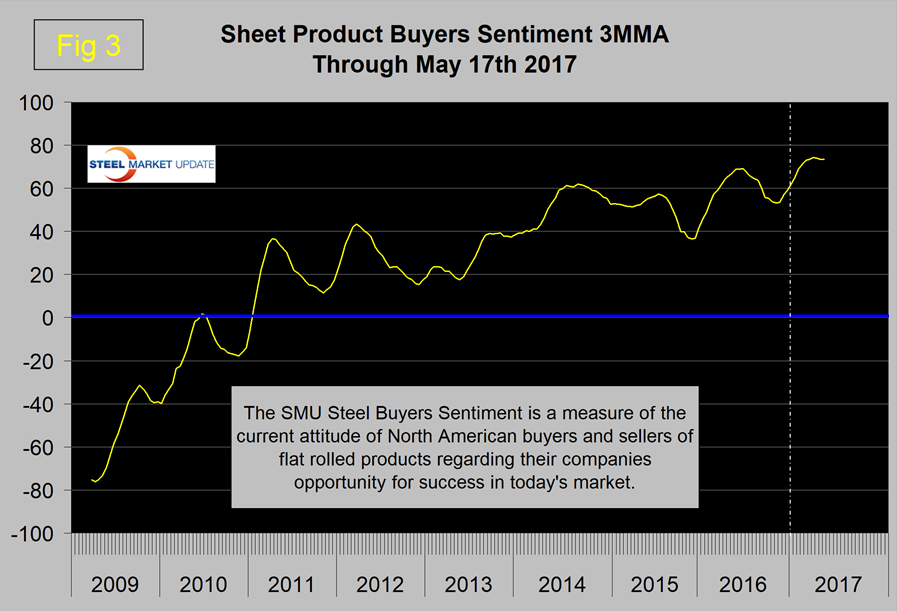
In the SMU index section the steel buyers sentiment has declined slightly from its all-time high in mid-March of 74.17 to 73.33 in mid-May (Figure 3).
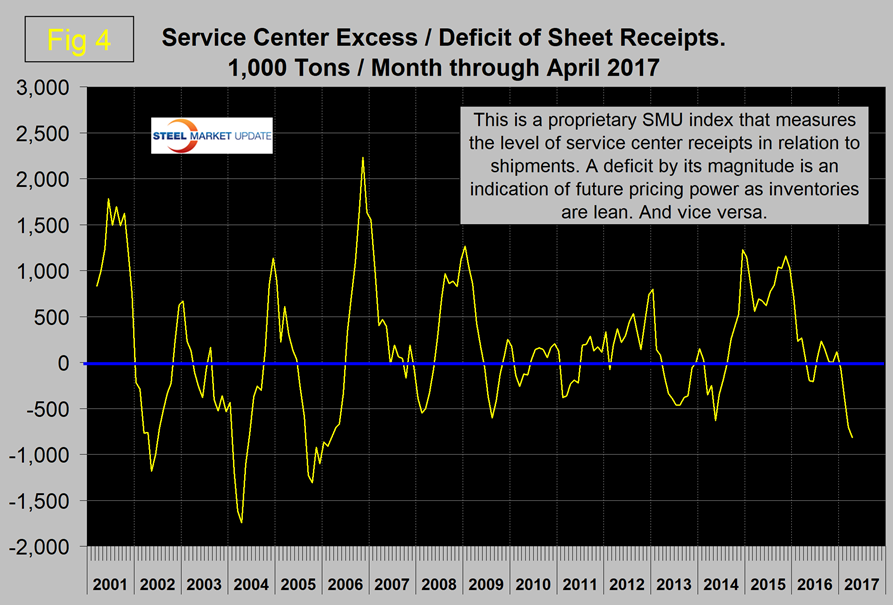
Service center excess of sheet products became negative in January and has become increasingly negative through April. This is a proprietary SMU calculation. We regard an inventory deficit to be positive in terms of pricing power and in April the deficit was 816,000 tons (Figure 4).
In the raw materials section the price of Chicago shredded was unchanged after declining in April. The price of iron ore continued to trend down, coking coal reversed course and trended down and zinc reversed course and trended up. We regard rising raw materials prices as positive and indicative of a strengthening market. Trends in the long product and sheet markets were the same. Both are experiencing an increase in net imports and a decrease in prices. There was no change in construction trends in May and in manufacturing the only trend reversal was in the ISM manufacturing index which declined slightly in April after a very strong surge in March.
We believe a continued examination of both the present situation and direction is a valuable tool for corporate business planning.
Explanation: The point of this analysis is to give both a quick visual appreciation of the market situation and a detailed description for those who want to dig deeper. It describes where we are now and the direction in which the market is headed and is designed to describe the market on a specific date. The chart is stacked vertically to separate the primary indicators of the general economy, of proprietary Steel Market Update indices, of raw material prices, of both sheet and long product market indicators and finally of construction and manufacturing indicators. The indicators are classified as leading, coincident or lagging as shown in the third column.
Columns in the chart are designed to differentiate between where the market is today and the direction in which it is headed. Our evaluation of the present situation is subjectively based on our opinion of the historical value of each indicator. There is nothing subjective about the trends section which provides the latest facts available on the date of publication. It is quite possible for the present situation to be predominantly red and trends to be predominantly green and vice versa depending on the overall situation and direction of the market. The present situation is sub-divided into, below the historical norm (-) (OK), and above the historical norm (+). The “Values” section of the chart is a quantitative definition of the market’s direction. In most cases values are three month moving averages to eliminate noise. In cases where seasonality is an issue, the evaluation of market direction is made on a year over year comparison to eliminate this effect. Where seasonality is not an issue concurrent periods are compared. The date of the latest data is identified in the third values column. Values will always be current as of the date of publication. Finally the far right column quantifies the trend as a percentage or numerical change with color code classification to indicate positive or negative direction.


