Prices

May 7, 2017
March Apparent Steel Up 6.7% Over February, Up 9.4% Over Last Year
Written by Brett Linton
According to the latest data released from the U.S. Department of Commerce and the American Iron and Steel Institute, apparent steel supply for the month of March 2017 was 9,300,718 net tons. Apparent steel supply is calculated by adding domestic steel shipments and finished US steel imports, then subtracting total US steel exports.
This is the highest apparent steel supply level seen since July 2015 when it was 9,409,421 tons. At that time, domestic shipments were 7,591,897 tons, finished imports were 2,630,576 tons, and total exports were 813,052 tons.
March apparent steel supply represents a 584,539 ton or 6.7 percent increase compared to the same month one year ago when apparent steel supply was 8,716,178 tons. The majority of this change came from an increase in domestic shipments and finished imports, increasing 315,042 tons (4.3 percent) and 442,833 tons (20.9 percent) respectively. Total exports lessened the overall rise in apparent steel supply as they rose 173,336 tons or 22.4 percent.
The net trade balance between US steel imports and exports was a surplus of +2,470,376 tons imported in March 2017, 35.3 percent higher than that of March 2016 when it was +1,825,488 tons. This is the highest net trade balance seen since July 2016 when it was 2,527,953 tons. Foreign steel imports accounted for 27.5 percent of apparent steel supply in March, up 3.2 percent over the same month one year ago.
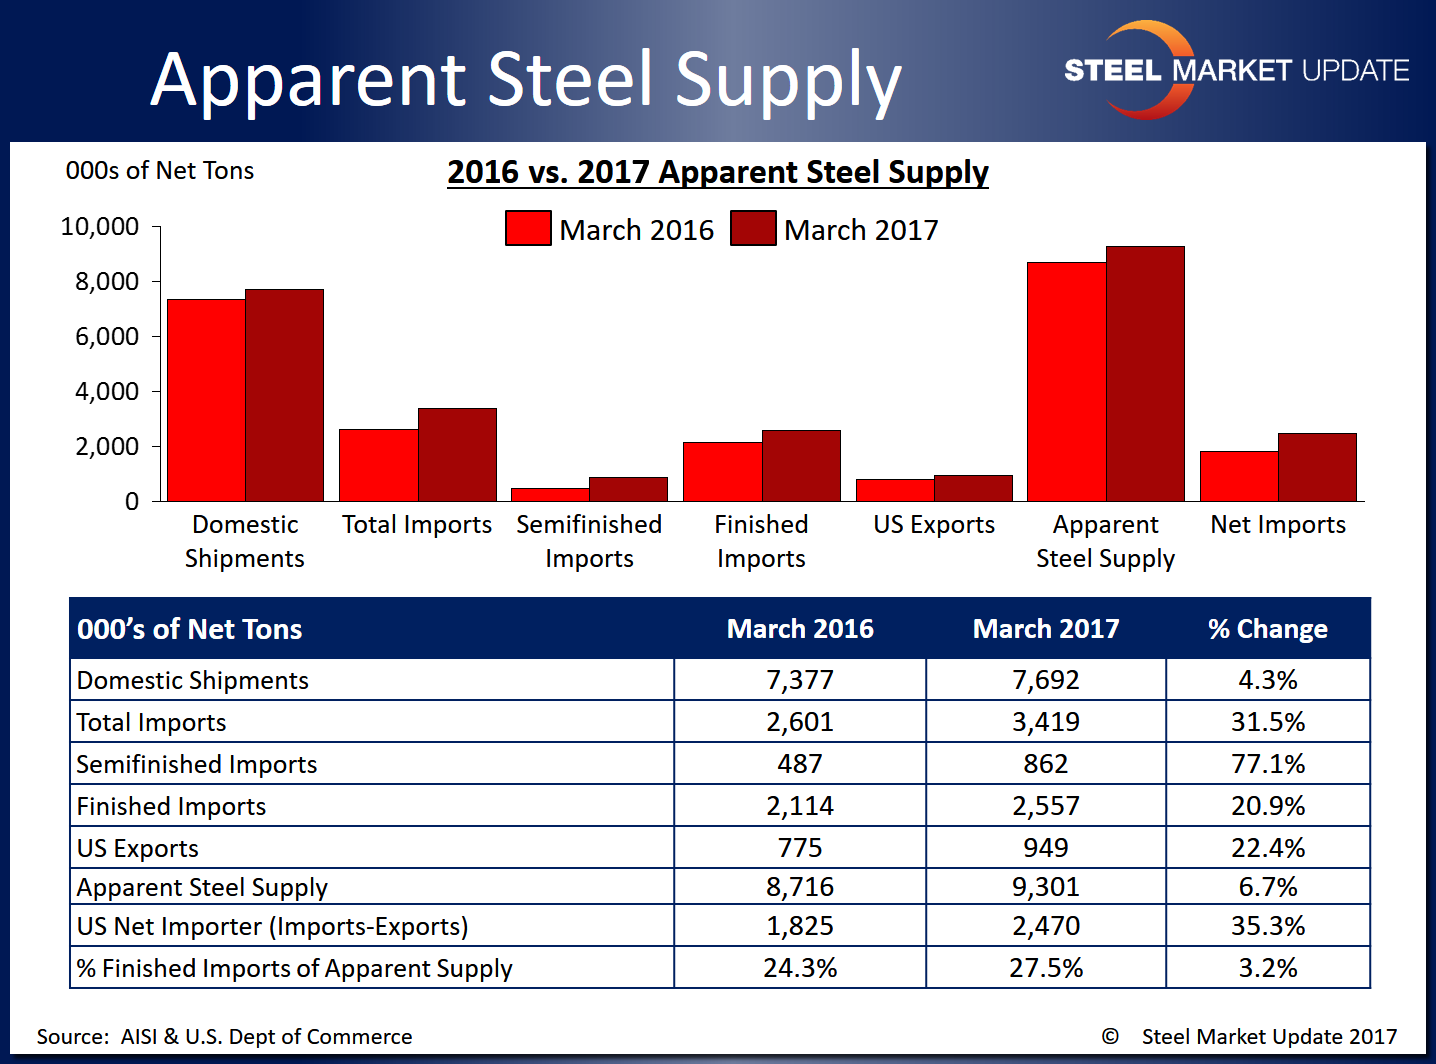
When compared to last month, when apparent steel supply was 8,501,854 tons and at a 1.5 year high, March supply increased by 798,864 tons or 9.4 percent. This was primarily due to an increase in domestic imports and finished imports, with domestic shipments up 460,093 tons or 6.4 percent and finished imports up 459,818 tons or 21.9 percent. An increase in total exports of 121,047 tons or 14.6 percent month over month lessened the overall increase in apparent steel supply.
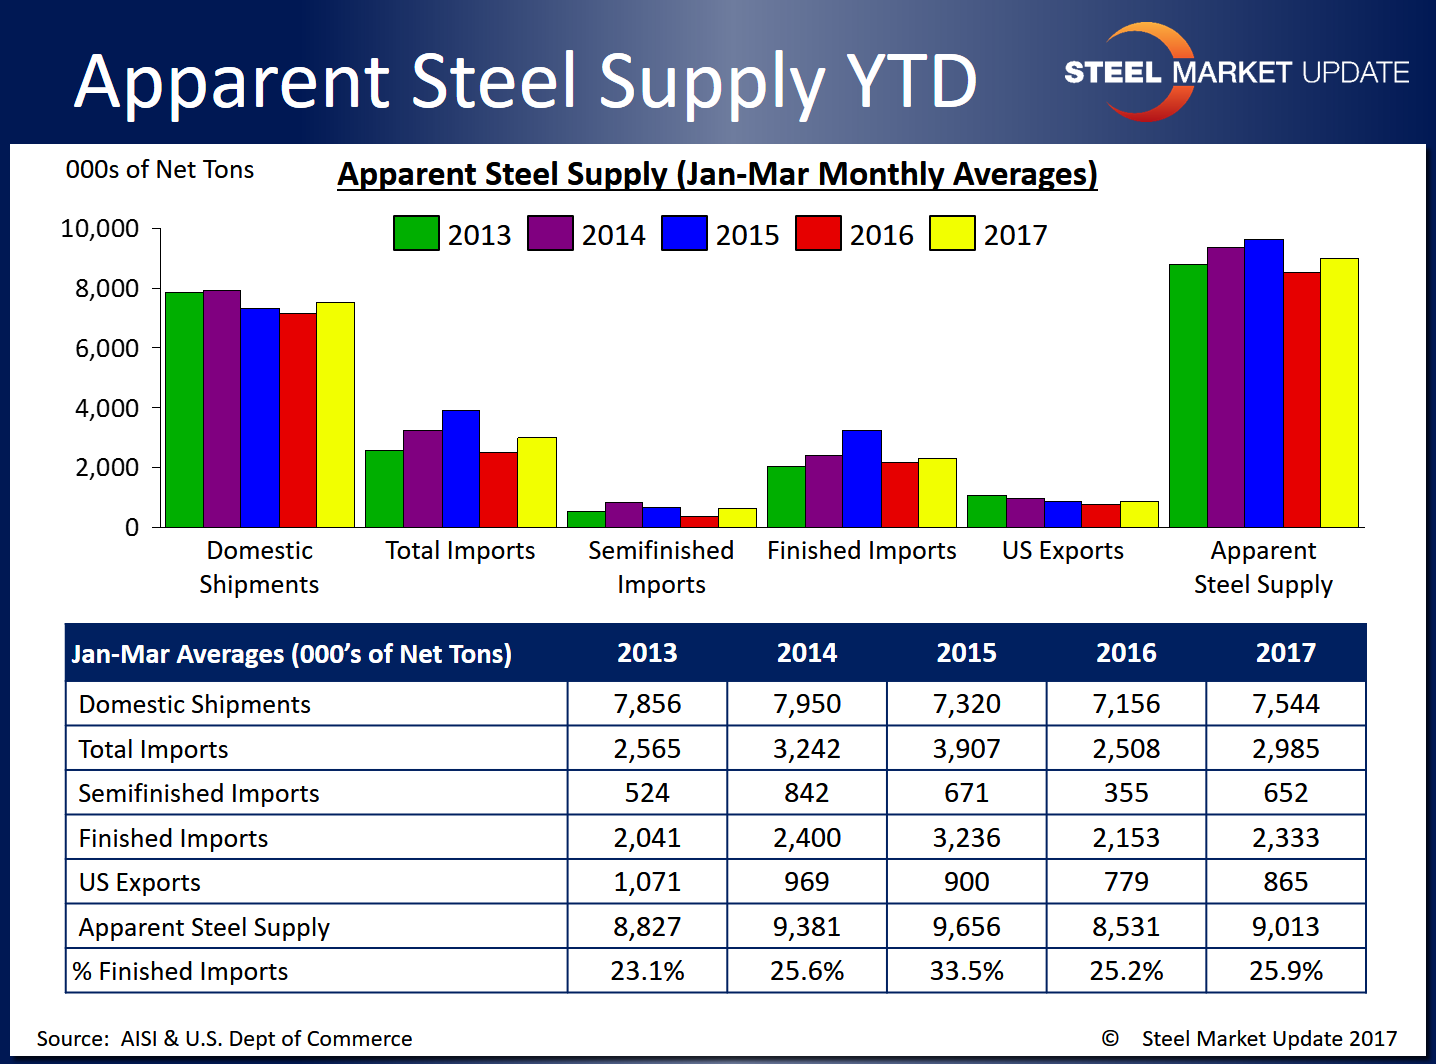
The table below shows year to date totals for each statistic over the last five years. Note that these averages are calculated through the first three months of each year for an equal comparison. As was the case last month, the 2017 data points seem higher than the 2016 figures, but are mixed compared to 2013-2015 data for all items listed.
To see an interactive graphic of our Apparent Steel Supply history, visit the Apparent Steel Supply page in the Analysis section of the SMU website. If you need any assistance logging in or navigating the website, contact us at info@SteelMarketUpdate.com or 800-432-3475.