Market Data

January 30, 2017
Currency Update for Steel Trading Nations
Written by Peter Wright
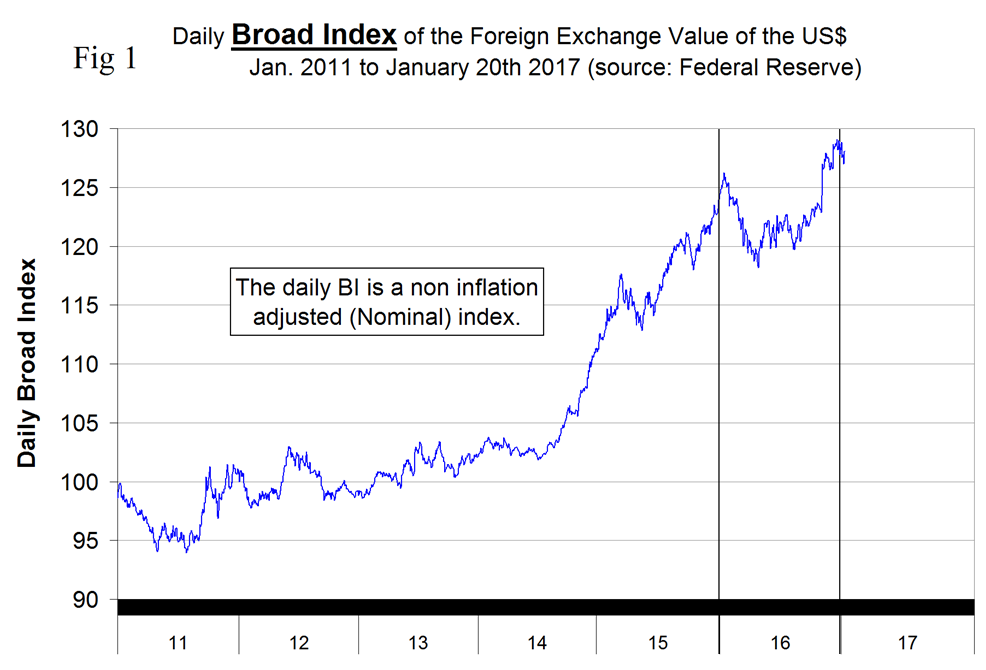
Please see the end of this report for an explanation of data sources. The Broad Index value of the US $ is reported several days in arrears by the Federal Reserve, the latest value published was dated January 20th (Figure 1).
The dollar had a recent peak of 128.9627 on January 3rd which was the highest value since April 4th 2004, almost 15 years. The escalation was driven by the Fed’s increase in its target short-term interest rate on the 14th of December to 50 – 75 basis points. Traders look for and anticipate interest rate differentials and the dollar now has a 1 percent advantage over the Euro and Japan remains mired in economic malaise. Based on the hawkish pronouncements of the Fed, the spread between the dollar and the Euro and the Yen could be 1.75 percent or more by this time next year. Since January 3rd the dollar has weakened to 128.0382 a decline of 0.7 percent.
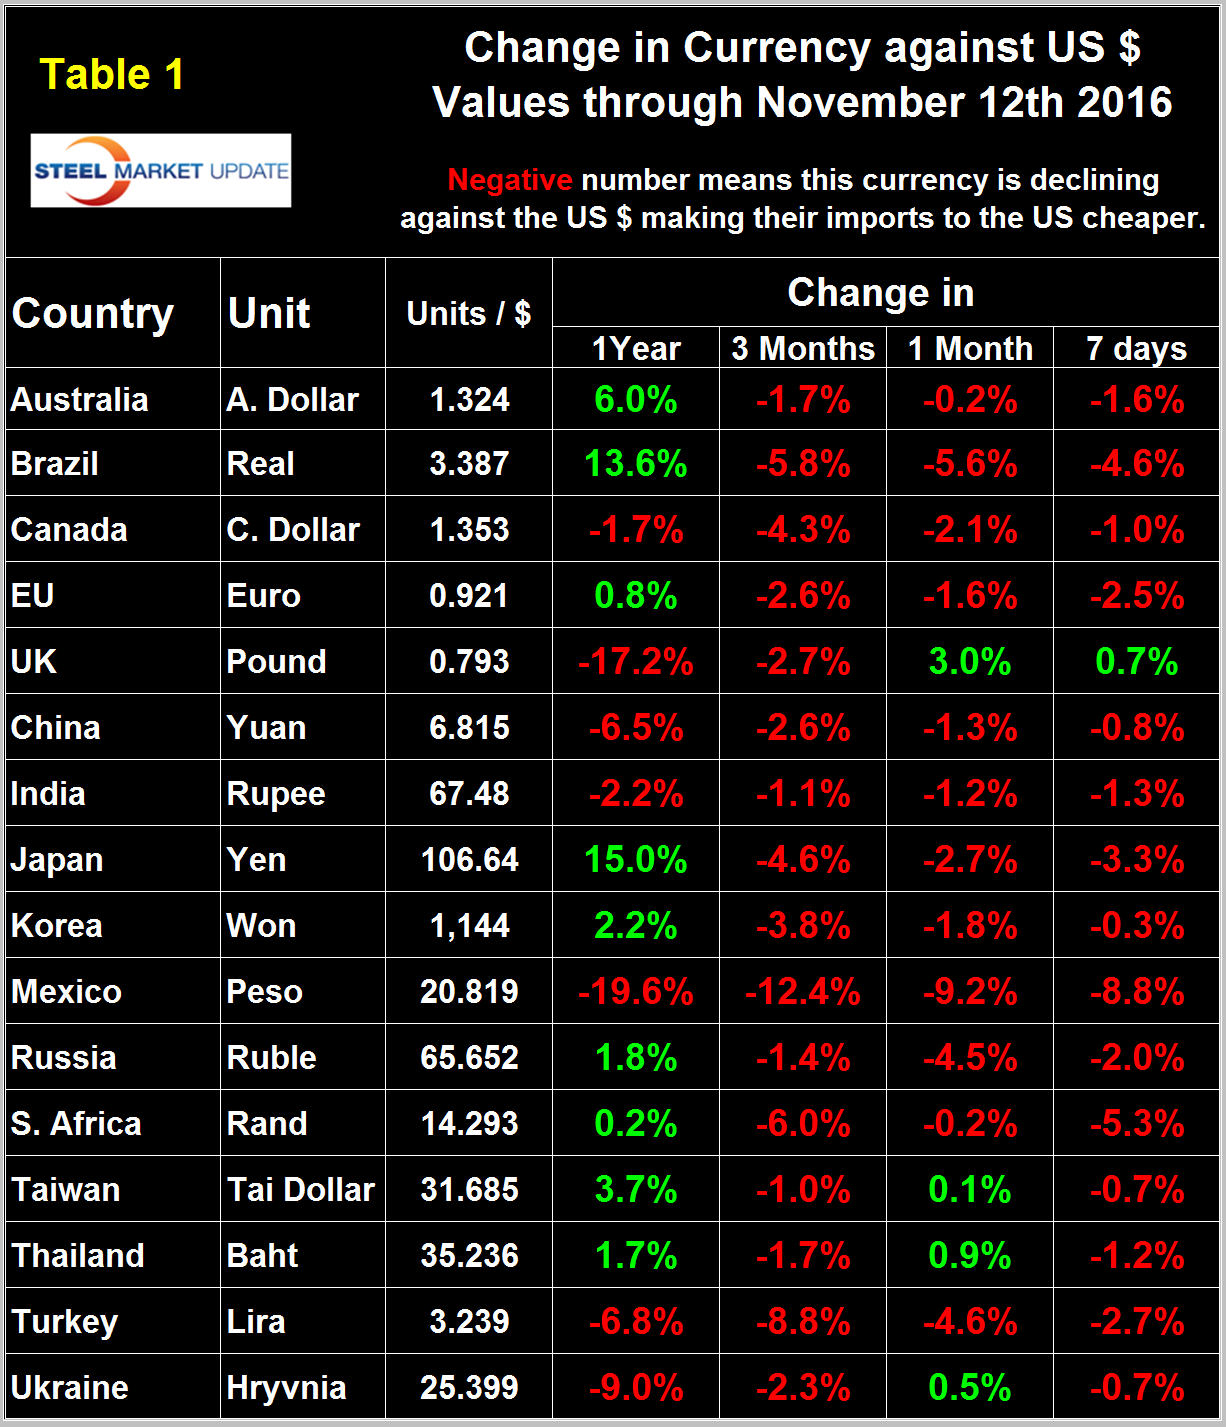
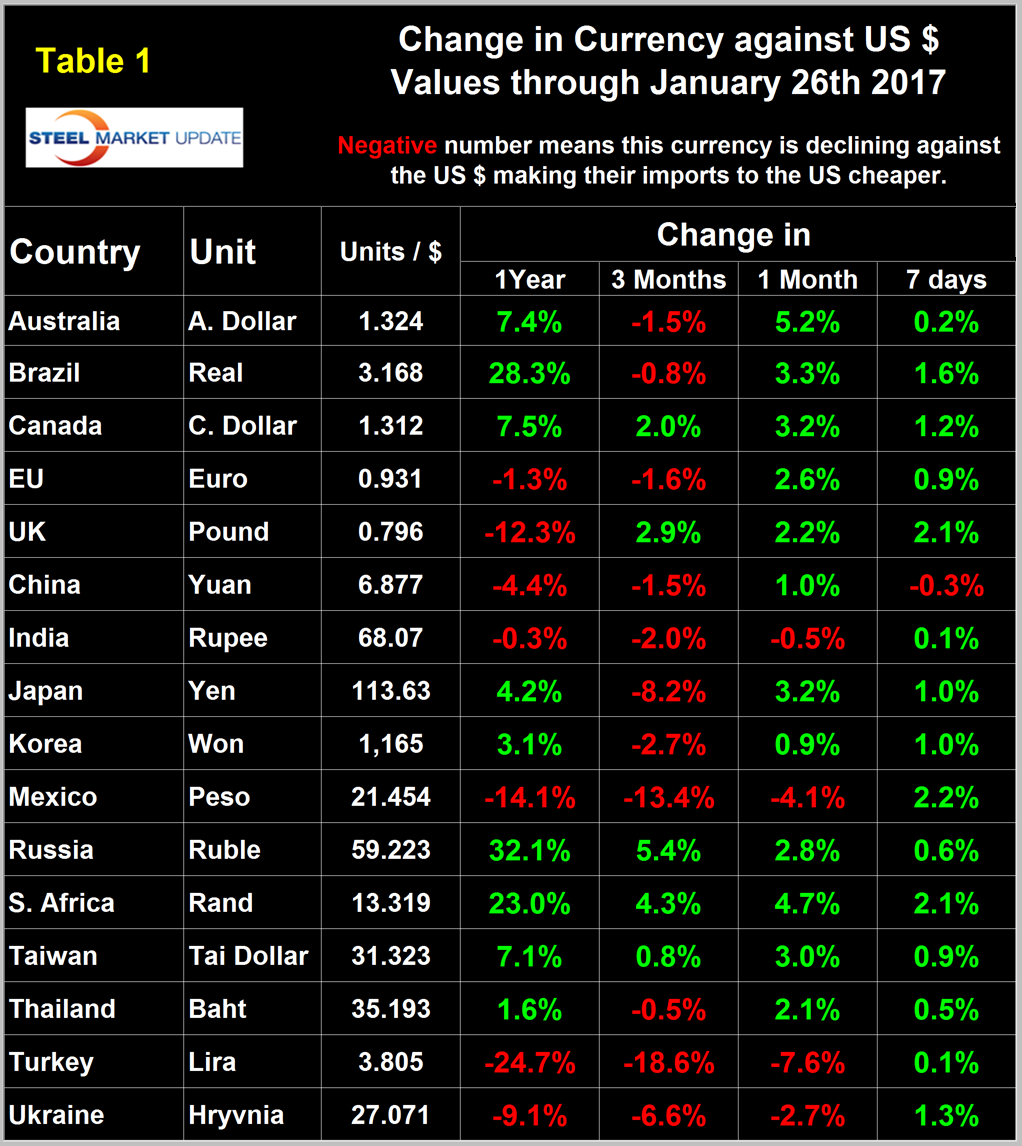
To illustrate the volatility of the currencies of the steel trading nations we have included in this report, two versions of Table 1, each of which shows the value of the US $ measured in the currencies of 16 steel and iron ore trading nations.
It reports the changes in one year, three months, one month and seven days for each currency and is color coded to indicate strengthening of the dollar in red and weakening in green. We regard strengthening of the US Dollar as negative and weakening as positive because the effect on net imports. An estimated 25 percent of the U.S. economy has some involvement in international trade therefore currency swings can have a large effect on the economy in general and of the steel industry in particular. Such a swing was evident in the GDP report published by the Bureau of Economic Analysis on Friday in which it was reported that net exports contributed negative 1.7 percent to GDP growth. The November 12th version of Table 1, immediately after the election and in anticipation of a near certain Fed rate increase, has the $ strengthening against 15 of the 16 currencies at the 7 day level and against 12 at the one month level.
After peaking on January 3rd a major reversal has occurred in the currencies of the 16 steel trading nations. Table 1 version January 26th has the dollar weakening against 15 of the 16 at the 7 day level and against 12 of the 16 at the one month level. An almost complete symmetrical reversal. This seems to indicate that traders think the party is over for the moment and they will take a breather before the run up to the next Fed meeting in April.
In each of these reports we comment on a few of the 16 steel trading currencies listed in Table 1. Charts for each of the 16 currencies are available through January 26th for any premium subscriber who requests them. We also include writings from experts who we regard as credible to explain some of the currency moves that we are witnessing.
The Mexican Peso
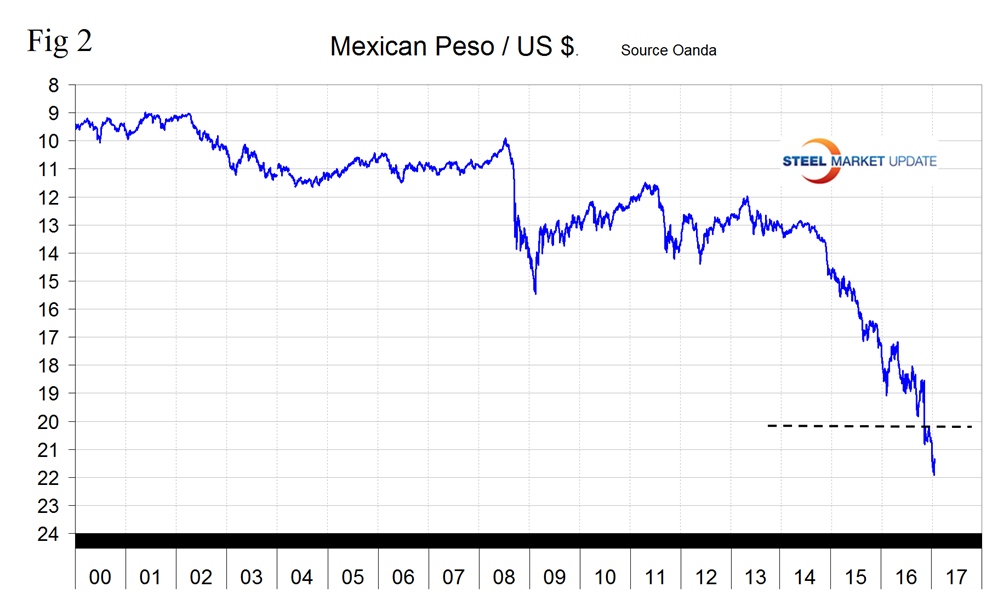
Two days after the US election the peso broke through the 20/US $ level for the first time ever and continued to decline until January 19th when it reached 21.9211/US $. Since then the peso has recovered to reach 21.4544/$ on January 26th (Figure 2).
The Peso has declined by 13.4 percent in the last three months and by 4.1 percent in the last month. On January 1st 1994, when the NAFTA was initiated it took only 3.5 pesos to buy one US dollar. On January 27th Mark Chandler wrote, “tensions between the US and Mexico may be the worst since 1920 when US President Coolidge threatened to invade. Trump has some discretion as US President, but the idea of a 20 percent tariff on Mexican imports to pay for the wall is bluster. First, it violates the NAFTA agreement. Second, if there were not NAFTA, it would violate the WTO. Third, the President would need Congressional support. He can impose a 15 percent temporary tariff claiming a balance of payments emergency, but this is extreme. Fourth, Mexico could retaliate.
Trade between the two countries is very complex. Some goods may cross the border several times before a final good is finished. Research suggests that as much as 40 percent of the content of Mexico’s exports originate in the US. Several European and Japanese automakers have production facilities in Mexico. If new tariffs become onerous, their production may not be moved to the US, but it could go home or to a third country.
The Chinese Yuan (Renminbi)
On January 27th dean Popplewell wrote, “The big story is the PBoC, which has told lenders to control their rampant lending policies to curb the excessive leverage they have contributed to the markets. Indeed, the curbs are guided more to the mortgage markets as the feel of a real estate bubble looms large
As for the currency, dealers’ focus is now shifting the “currency manipulator” storyline again. Times are certainly different from yesteryear, when China was prone to manipulate its currency to the benefit of Chinese exporters. However, today, China continues to iron-grip the yuan to prevent unwanted currency depreciation, which has been at the heart of the financially destabilizing increase in capital outflow. So much so that it is hindering the yuan’s global acceptance among international investors who have been advocating for more liberal exchange rate policies for years. Given the fact that the US Treasury has not declared China as a currency manipulator since 1994, it is unlikely they can or will make that claim. However, the real question is: What would happen if the US Treasury did take this course? Well, not much, other than a futile attempt to jawbone the markets. Investors will likely brush aside the comments and continue to express their current bias for longer-term yuan depreciation.”
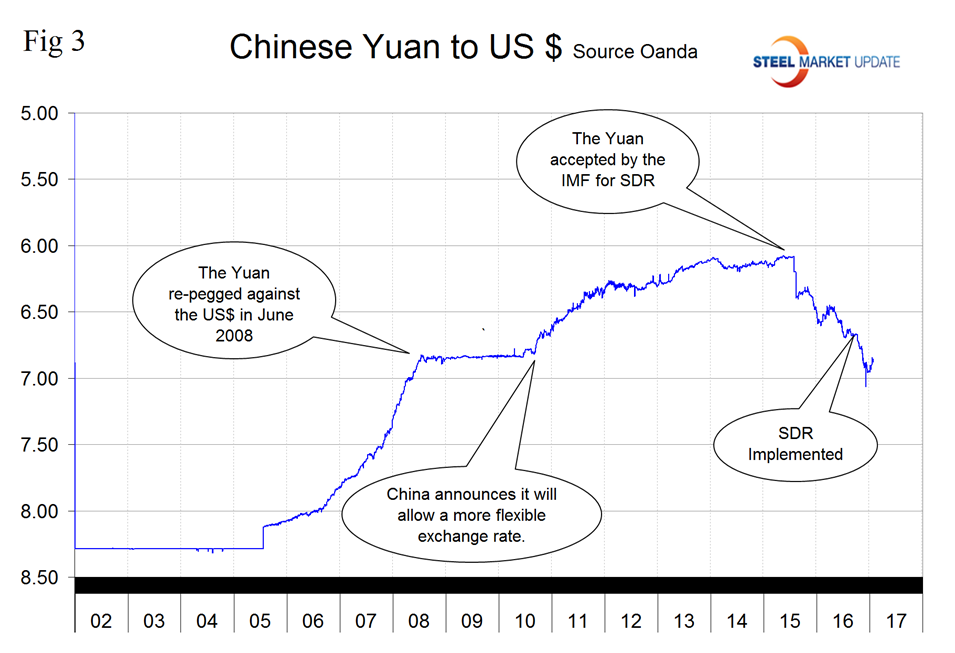
The Yuan has declined by 4.4 percent against the US $ in the last year and by 1.5 percent in the last three months (Figure 3). On January 6th the Yuan briefly broke through the 7/dollar level then recovered to 6.868 on January 26th.
The Turkish Lira
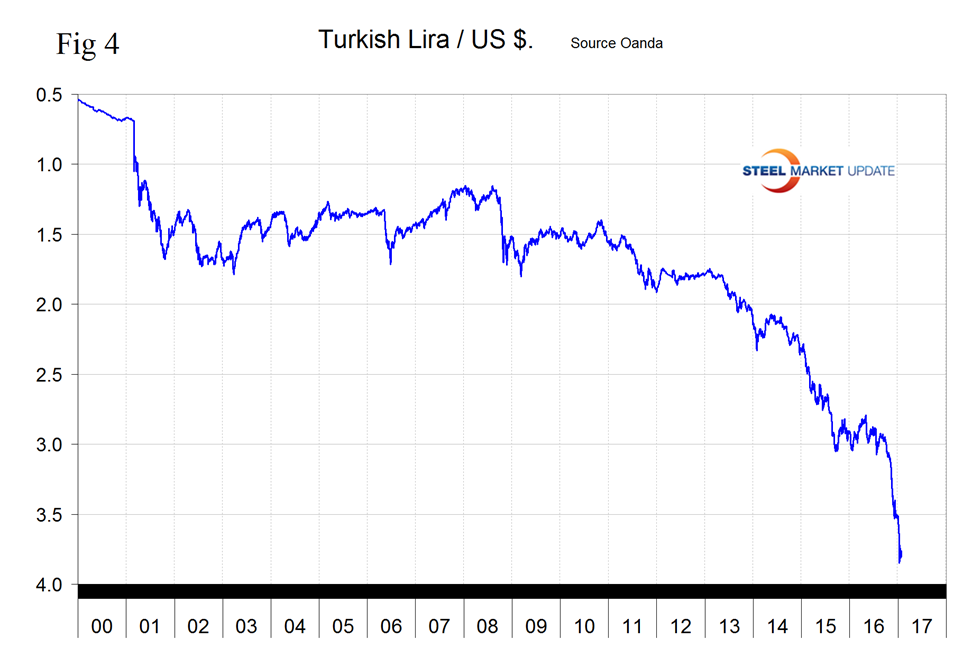
The Turkish Lira has been in free fall since September last year and bottomed out at 3.8484 Lira to the dollar on January 11th since when it had recovered to 3.8045 on the 26th. The Lira is down by 24.7 percent in one year, by 18.6 percent in three months and by 7.6 percent in one month, Figure 4.
Dean Popplewell wrote on January 29th: “the USD/Turkish Lira had a wild ride in very thinly traded markets when comments from Turkey’s President Erdogan hit the news ticker. He has said “that raising interest rates would impact both the currency and inflation in a negative direction and defended the removal of the top-bottom issue to maintain the policy rate,” which green-lighted” the TRY bears to sell Lira as the prospects of additional intervention on the Turkey interest rate money markets is now unlikely.
While the confluence of the Credit Rating Agency’s warnings and downgrades added some fuel to the fire, we have come to accept that rating agency induced moves have little legs. However given the sheer amount of negative momentum in the Lira, it certainly didn’t help matters.
The Euro
On January 27th Kenny Fisher wrote: “the EUR/USD was almost unchanged in the Friday session. Currently, the pair is trading just above the 1.07 level. There are no major Eurozone economic releases imminent. There was positive news out of Germany, as consumer confidence continues to rise. The GfK Consumer Climate report rose to 10.2 points in December, climbing for a third consecutive month. Still, the Eurozone consumer is not as optimistic. Eurozone Consumer Confidence, released earlier this week, was unchanged at -5 points. The Eurozone is showing some improvement, as manufacturing and inflation numbers continue to point upwards. On Thursday, an IMF report found that economic growth was improving and projected growth of 1.6 percent in 2017 and 2018. However, the report also warned that political instability could be a drag on the economy, with Britain’s departure from the EU and elections in several countries where many voters are skeptical about European integration.
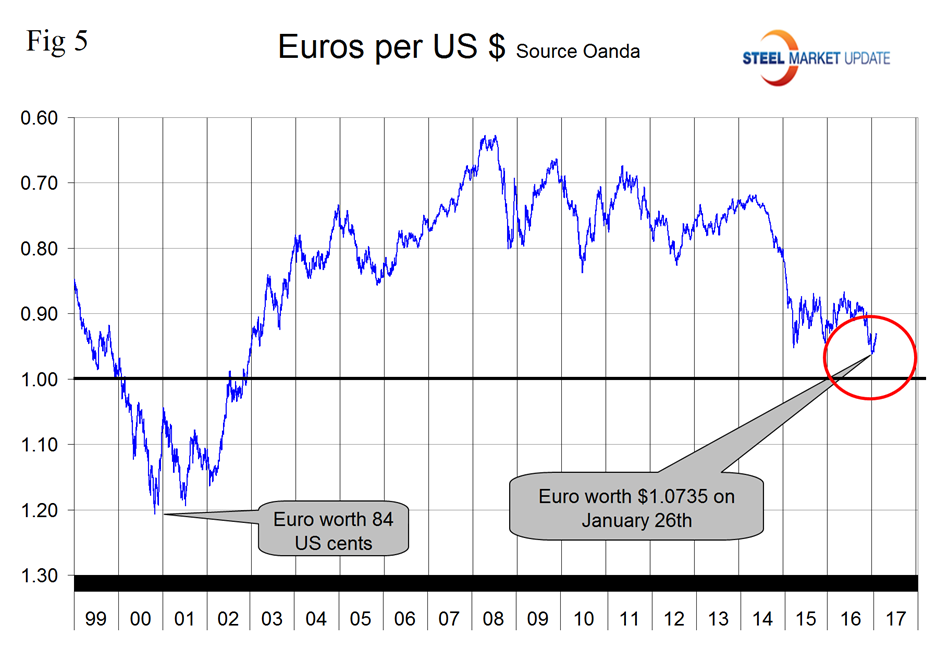
The Euro has declined by 1.6 percent in the last three months but has gained 2.6 percent in the last month (Figure 5).
The Russian Ruble
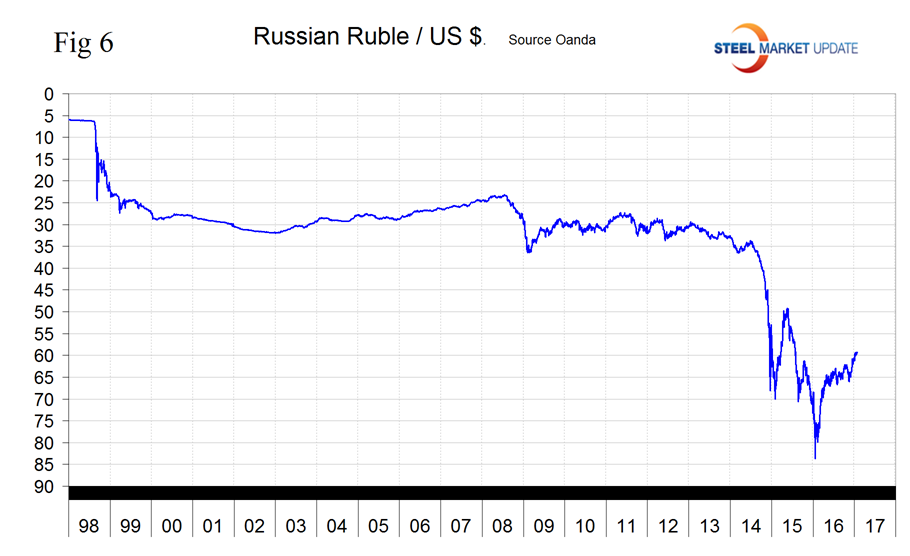
The Ruble bottomed out at 83.67/US $ on January 21st last year. Since then it has gained 32.1 percent to reach 59.223/US $ on January 26th this year (Figure 6).
On January 26th Oleh Kombaiev wrote, “During 2016, the ruble strengthened by 29 percent against the dollar, becoming one of the most profitable currencies among the countries with developing economies. However, don’t expect a similar appreciation in 2017 because, apparently, this is contrary to the plans of the Russian Government. The budget of the Russian Federation for 2017 implies the oil price at the level of $40 per barrel and the average ruble exchange rate of 67.5 rubles per dollar. Thus, the budget implies the oil price at the level of 2,700 rubles per barrel. However, the current oil price and the ruble exchange rate correspond to the oil price of 3300 rubles per barrel. As we see, there is an opportunity to generate additional income. The Ministry of Finance estimates that the additional budget revenue with the oil price of $55 will be about 1.5 trillion rubles (~ $25 billion) over the year. It follows that, on average, the Ministry of Finance will be able to buy $2 billion per month, or about $10 million per day. In my opinion, this amount is not critical for the Russian money market and will not lead to the collapse of the ruble, but will create a resistance to its strengthening, if the oil prices increase. Against this background, I believe that the USD/RUB currency pair in the coming months will be traded in the range of 58.5-61 rubles without a trend towards more significant reduction.
Explanation of Data Sources: The broad index is published by the Federal Reserve on both a daily and monthly basis. It is a weighted average of the foreign exchange values of the U.S. dollar against the currencies of a large group of major U.S. trading partners. The index weights, which change over time, are derived from U.S. export shares and from U.S. and foreign import shares. The data are noon buying rates in New York for cable transfers payable in the listed currencies. At SMU we use the historical exchange rates published in the Oanda Forex trading platform to track the currency value of the US $ against that of sixteen steel trading nations. Oanda operates within the guidelines of six major regulatory authorities around the world and provides access to over 70 currency pairs. Approximately $4 trillion US $ are traded every day on foreign exchange markets.


