Market Data

September 30, 2016
Currency Update for Steel Trading Nations
Written by Peter Wright
The Fed once again elected not raise rates in their September 21st announcement. On the 22nd Ian Bezek had this to say: “For those who wanted decisive action, the Fed’s latest move failed to please, however, there were three dissenters against the decision – a large number for the Fed – and the vast majority of Fed members see a hike coming before year-end. Current economic data seemingly met the Fed’s standards for an immediate hike. Whether they didn’t want blame for causing market volatility ahead of an election, or other reasons, the Fed chickened out on a September hike. But, with that many dissenters, the Fed is virtually forced into making the next hike in December. The initial reaction to the news seems positive. Stocks jumped and volatility tanked. The dollar moved lower, generating enthusiasm for emerging market shares, along with commodities. Gold and precious metal miners in particular loved the Fed’s decision to forego an immediate hike.”
On September 26th Andrew Hecht wrote, “The greenback is in neutral. It does not know which way to go. Compared to the other major currencies of the world, the dollar remains attractive from a yield perspective, but the greenback continues to go nowhere. The dollar has the most contentious election in history in front of it, but it refuses to tank. In their statement, the central bank reiterated that the case for a rate hike has strengthened. They pointed to moderate economic growth and positive employment data. They told markets that risks to the U.S. economy have diminished, and inflation is moving toward the 2 percent target rate. However, at the end of the day, despite three dissenters, the Fed decided to wait for further evidence of “continued progress” in the economy before they will finally pull the rate-hike trigger.”
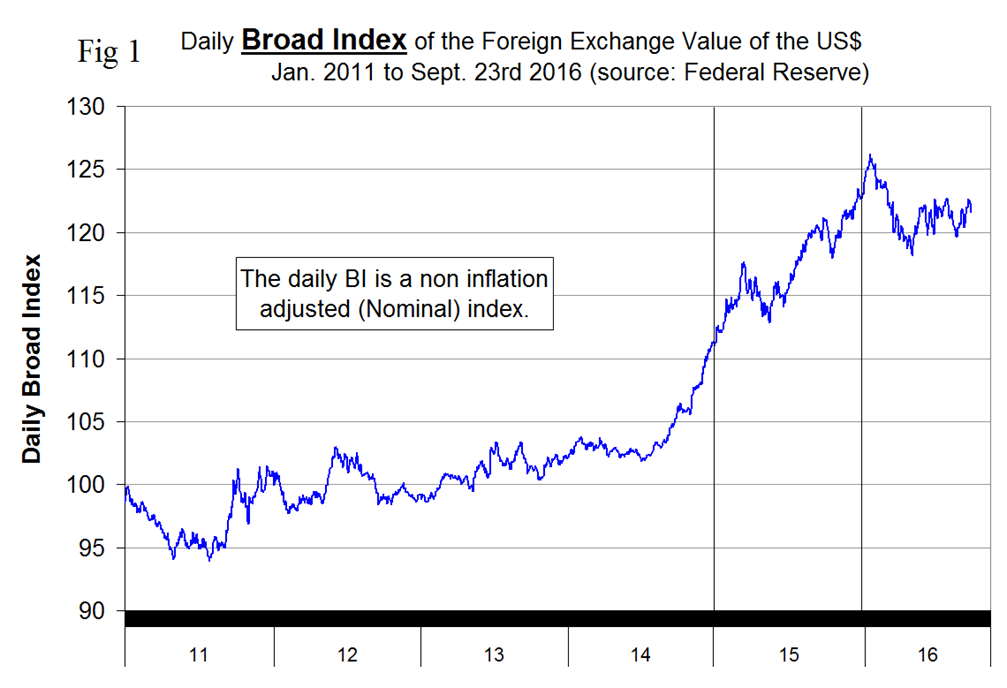
Please see the end of this report for an explanation of data sources. The Broad Index value of the US $ is reported several days in arrears, the latest value we have was dated September 23rd (Figure 1).
The dollar has lacked direction since early May as traders have correctly anticipated a lack of action on rates by the Federal Reserve. In three months since July 23rd the dollar index has moved by only 0.3 percent.
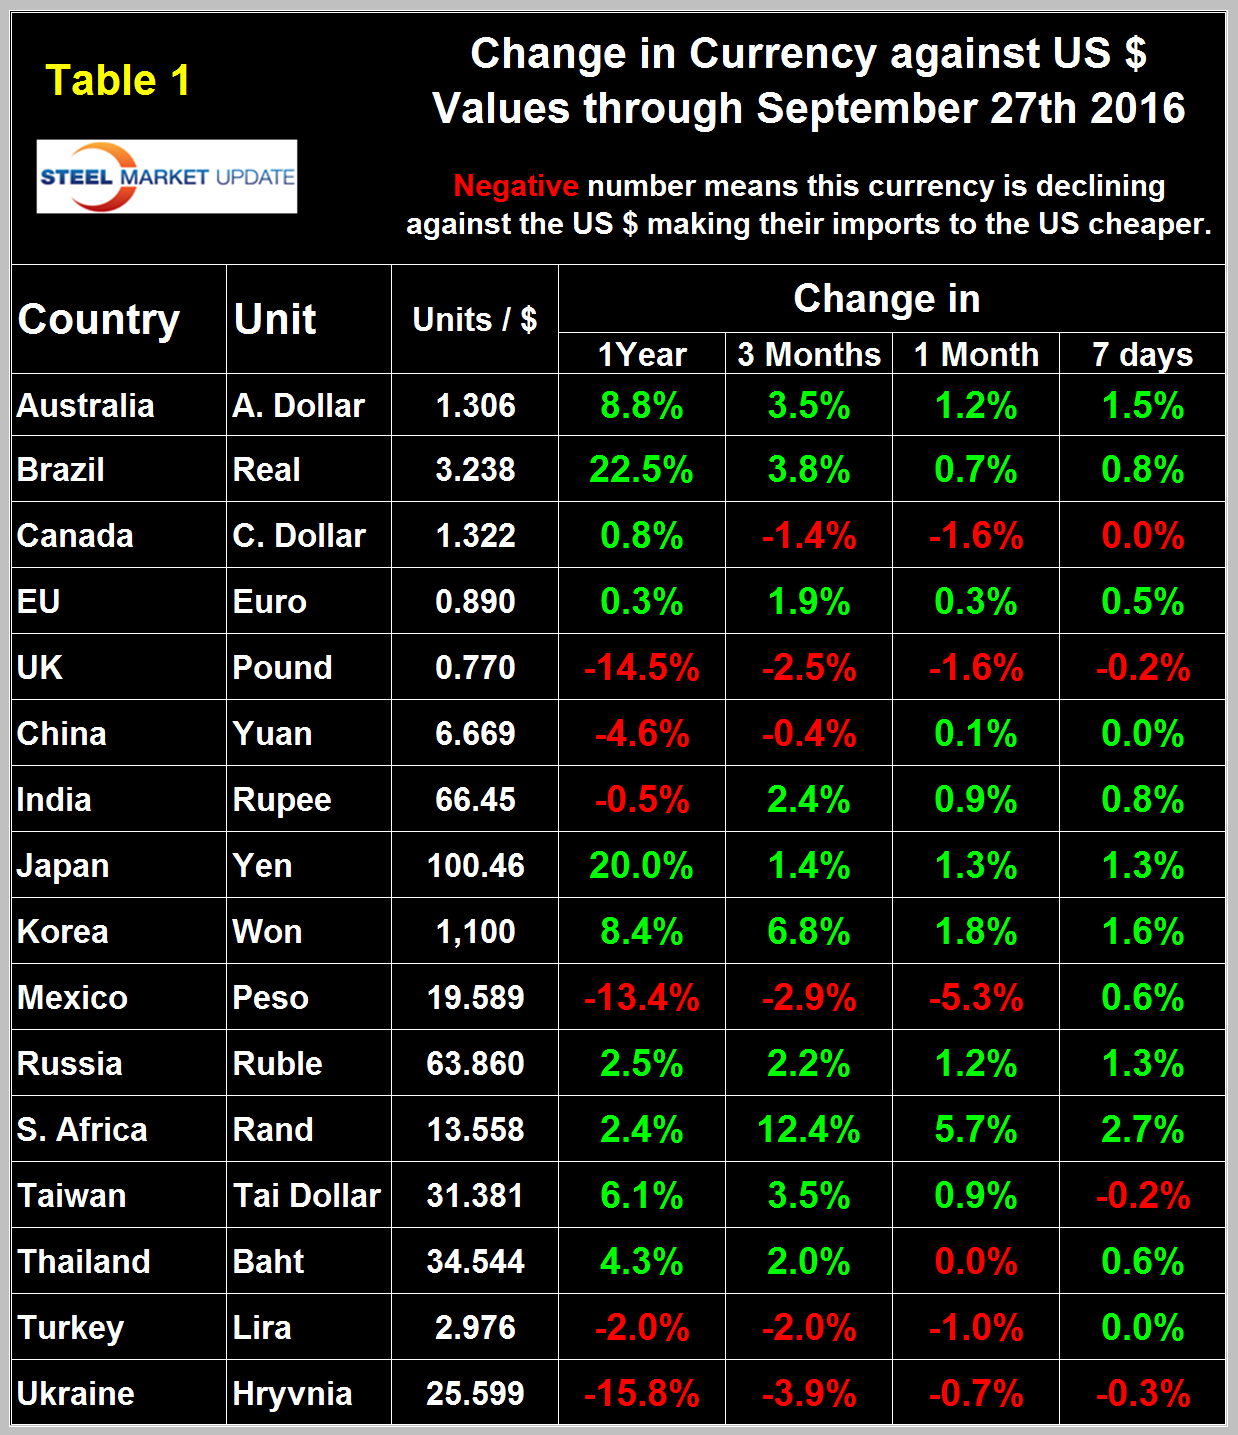
Table 1 shows the value of the US $ measured in the currencies of 16 steel and iron ore trading nations on September 27th, it reports the changes in one year, three months, one month and seven days for each currency and is color coded to indicate strengthening of the dollar in red and weakening in green. We regard strengthening of the US Dollar as negative and weakening as positive because the effect on net imports.
An estimated 25 percent of the U.S. economy has some involvement in international trade therefore currency swings can have a large effects on the economy in general and of the steel industry in particular. At the one month level and since our last report on August 26th the dollar has weakened against ten of the sixteen and strengthened against the others. At the seven day level shown in Table 1 the dollar has weakened against 12 of the 16 as the Fed elected not to move.
In each of these reports we comment on a few of the 16 steel trading currencies listed in Table 1. Charts for each of the 16 currencies listed in Table 1 are available through September 27th for any subscriber who requests them.
The Mexican Peso
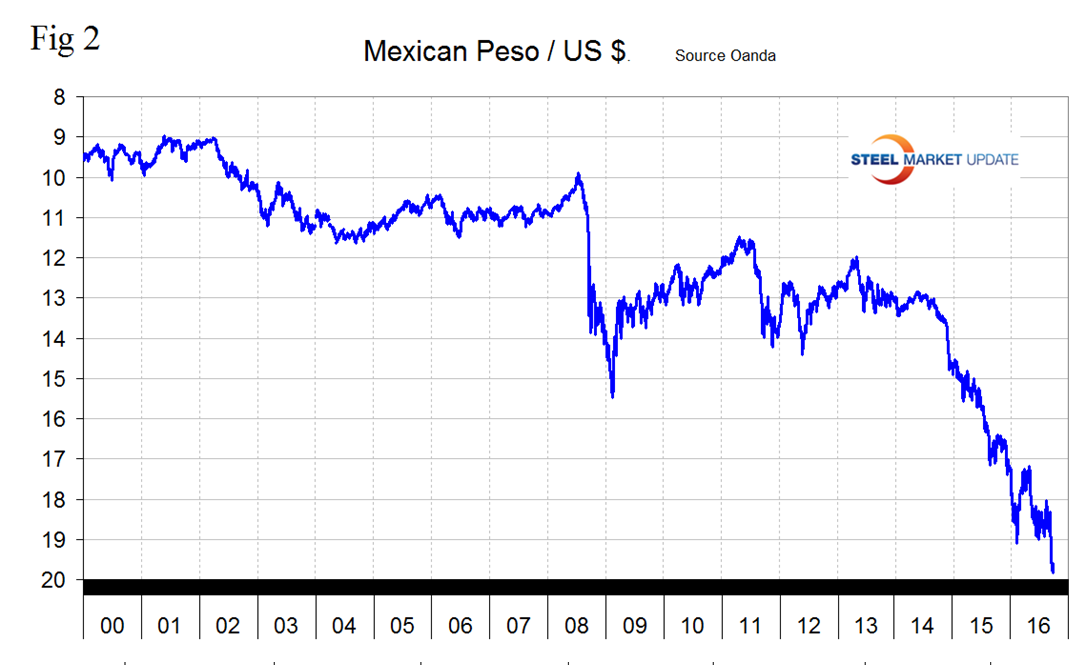
The Mexican Peso has experienced the greatest change in the last month having declined by 5.3 percent in a move which we interpret to be largely a reaction to negative comments about NAFTA by a presidential contender. The peso has declined by 13.4 percent in the last year but recovered by 0.6 percent in the last 7 days (Figure 2).
Mark Chandler wrote on Sept 27th: the first US Presidential debate may not sway many voters but caused the Mexican peso to reverse course. The peso, which had fallen by about 1.3 percent over the past two sessions, stormed by 1.5 percent on Tuesday as the seemingly biggest winner of the debate. Snap polls immediately following the debate gave the edge to Clinton. Speculators had amassed a near-record gross short peso position in the futures market which had more than doubled over the past three weeks to 109.9k contracts as the polls indicated the contest had tightened markedly since the end of August. The bears had added 24k contracts alone in the five-day reporting period ending September 20.
The Canadian Dollar
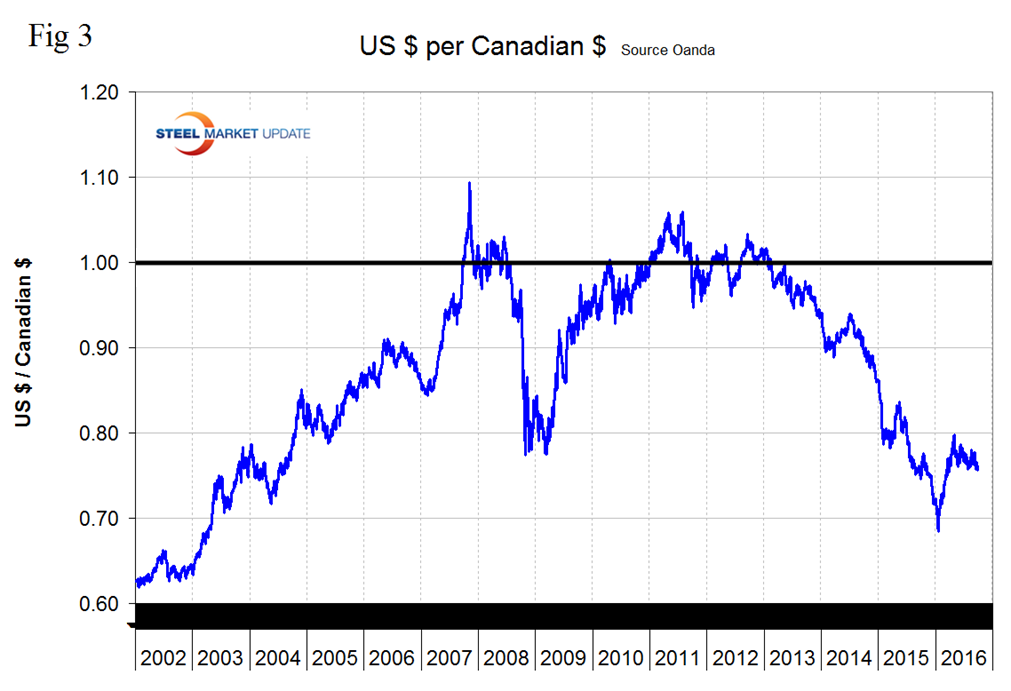
The Canadian Dollar has had a less extreme reaction to NAFTA talk but is down by 1.6 percent in the last month (Figure 3). The loonie was worth 75.67 US cents on September 27th and was unchanged in the last 7 days. The C $ had a recent low of 68.48 US cents on January 20th this year.
The Euro
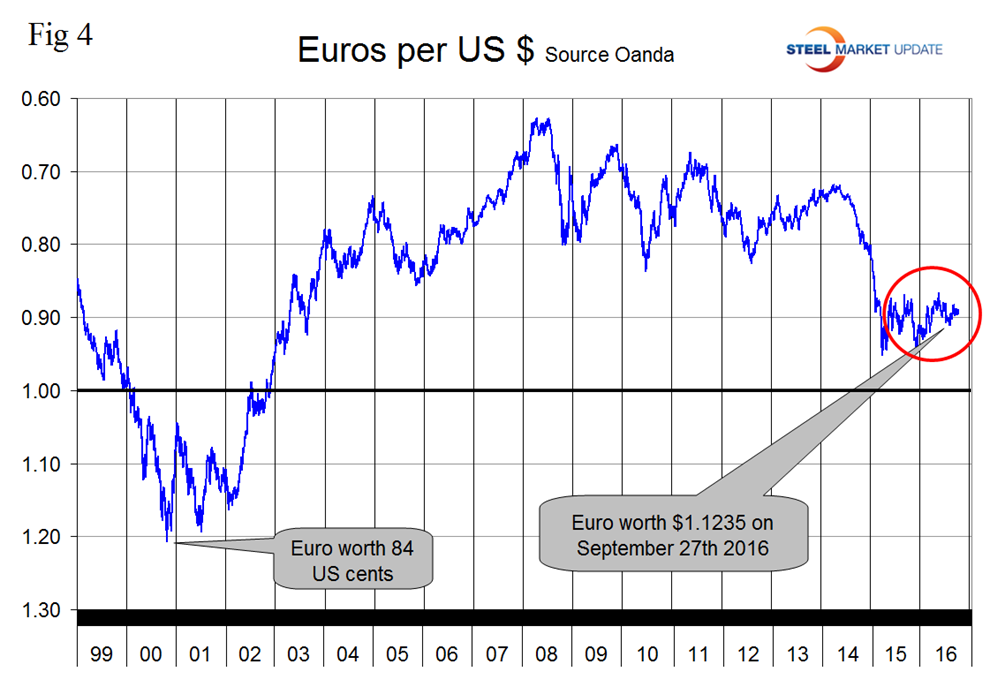
On September 27th it took 1.1235 US dollars to buy one Euro (Figure 4). Through that date the Euro had strengthened by 1.9 percent in three months and 0.3 percent in one month. The Euro had a recent low of 1.0580 on November 30th last year. On September 2nd Mark Chandler, Global Head of Currency Strategy at Brown Brothers Harriman said, “I still believe before this cycle ends, the euro will sell off further, and I do still target the old lows of 82-85 cents back in 2000. The euro had a 35-cent move, from $1.40 to $1.05, and since then has been consolidating between $1.08 and $1.16 and in a band that is still wide enough for traders to lose a lot of money. With this type of broad sideways trading, investors should be asking whether this is a base (for a move higher) or a top (for a move lower). And I think this will prove more likely to be a top for the euro. The ECB is still easing while the Fed is tightening. Before the ECB is done easing, the Fed will tighten a few more times. Combining the health of the European banking system with the political environment and uncertainty from elections in Italy, France and Germany all point to a weaker euro.”
The Turkish Lira
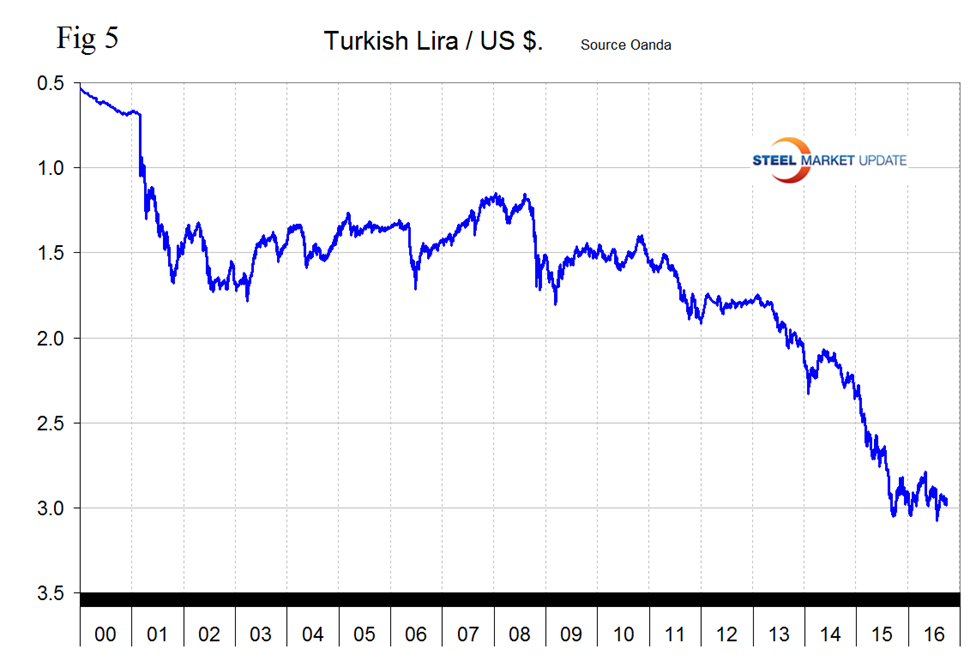
The Turkish Lira took a dive on news of the coup attempt to an all-time low of 3.076/US $ on July 21st but has since recovered to 2.976 however this represents a decline of 1.0 percent in the last month and once again is flirting with the 3.0 to the dollar level (Figure 5).
The Japanese Yen
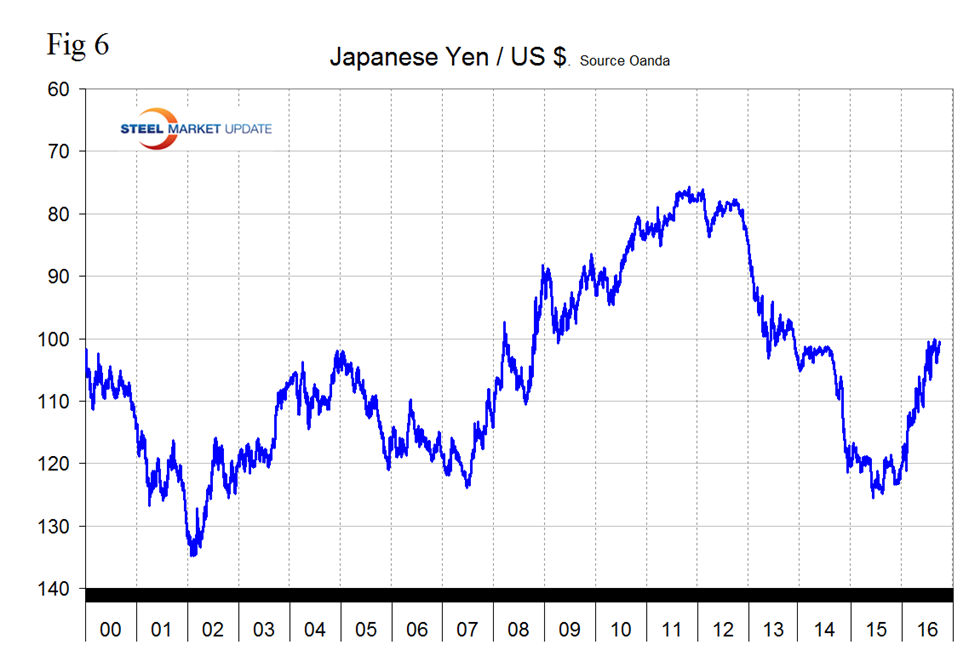
Figure 6 shows the value of the Yen since January 2000.
The Yen has been on a bull run for all of 2016 and this year has strengthened by 19.6 percent against the US dollar. The yen has appreciated by 1.3 percent in the last month. Marc Chandler: Only in the last couple of months have I started putting a few explanations together for the counterintuitive yen strength. I have two major points: Thinking back to yen weakness, I now think that was driven more by diversification of Japanese pension funds into global assets than by Japan’s monetary policies. Japanese pension funds sold JGBs and bought foreign bonds and stocks. Japanese companies kept more money offshore to get better yields. This all turned this year, and Japanese institutional investors were unhedged. They were taking “naked” U.S. dollar currency exposures, and when the yen strengthened, they were forced to raise their dollar hedge ratios, sending the yen higher.
On September 21st Wall St. breakfast reported: Japan’s central bank held rates steady at -0.1 percent following its latest meeting, but announced it would modify its policy framework, marking the latest attempt to boost prices and goose economic growth. Among the changes, the BOJ said it would introduce yield curve controls, eliminate the maturity range of its bond purchases, abandon its monetary base targets and confirmed that cutting rates further remained an option.
Explanation of Data Sources: The broad index is published by the Federal Reserve on both a daily and monthly basis. It is a weighted average of the foreign exchange values of the U.S. dollar against the currencies of a large group of major U.S. trading partners. The index weights, which change over time, are derived from U.S. export shares and from U.S. and foreign import shares. The data are noon buying rates in New York for cable transfers payable in the listed currencies. At SMU we use the historical exchange rates published in the Oanda Forex trading platform to track the currency value of the US $ against that of sixteen steel trading nations. Oanda operates within the guidelines of six major regulatory authorities around the world and provides access to over 70 currency pairs. Approximately $4 trillion US $ are traded every day on foreign exchange markets.


