

Market Data

August 31, 2016
Key Market Indicators - August 2016
Written by Peter Wright
An explanation of the Key Indicators concept is given at the end of this piece for those readers who are unfamiliar with it. This will explain the difference between our view of the present situation which is subjective and our analysis of trends which is based on the latest facts available. At the end of August we have a situation where the present situation is improving and trends are deteriorating slightly. It is quite common for these two views to move in opposite directions.
![]() The total number of indicators considered in this analysis is currently 36.
The total number of indicators considered in this analysis is currently 36.
Please refer to Table 1 for the view of the present situation and the quantitative measure of trends.
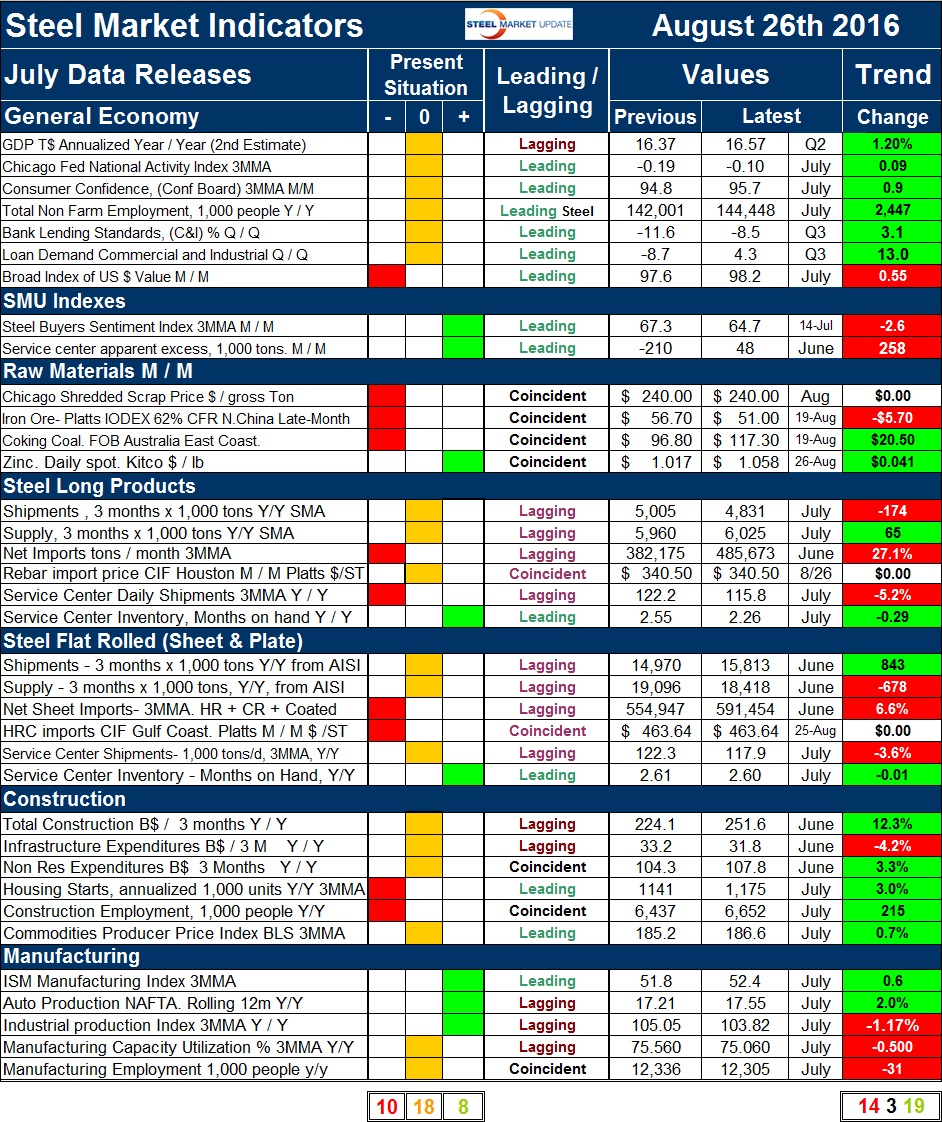
Readers should regard the color codes in the present situation column as a quick look at the current market condition. The “Trend” columns of Table 1, are also color coded to give a quick visual appreciation of the direction in which the market is headed. All data included in this table was released in August, the month or specific date to which the data refers is shown in the second column from the far right and all data is the latest available as of August 26th, 2016.
Present Situation
There was a decrease of three in the net number of negative indicators which translates into an increase of two neutral and one positive since we last published on July 31st. Our intent in using the word neutral is to say that this indicator is considered to be in the mid-range of historical data. Changes that occurred in the last month were as follows. There are two indicators that we extract from the Federal Reserve Senior Loan Officer survey. These are demand for and ease of obtaining commercial and industrial loans. Based on the third quarter data we re-classified these as positive on a historical basis. There were no changes in the present situation of the SMU proprietary indexes, in raw materials prices, in the market situation of the long and flat steel market sectors or in our view of construction. In the manufacturing section we re-classified the ISM manufacturing index as positive as its three month moving average (3MMA) rose above the 52 threshold that we consider to be the positive realm. Manufacturing capacity utilization increased to above the 75 percent threshold that we consider to be the boundary between negative and neutral. We currently regard 8 of the 36 indicators to be positive, 18 to be neutral and 10 to be negative on a historical basis. The present situation of the general economy is considered to be neutral except for the value of the US $ which we consider to be negative from the point of view of net imports. Both the SMU proprietary indexes are strong, and with the exception of zinc all the raw materials prices are weak. The present situation of the long and flat steel sectors are similar being negative to neutral except for service center inventories which are in relatively good shape. Construction is neutral to weak and manufacturing in neutral to strong.
Figure 1 shows the change in our assessment of the present situation since January 2010 on a percentage basis.
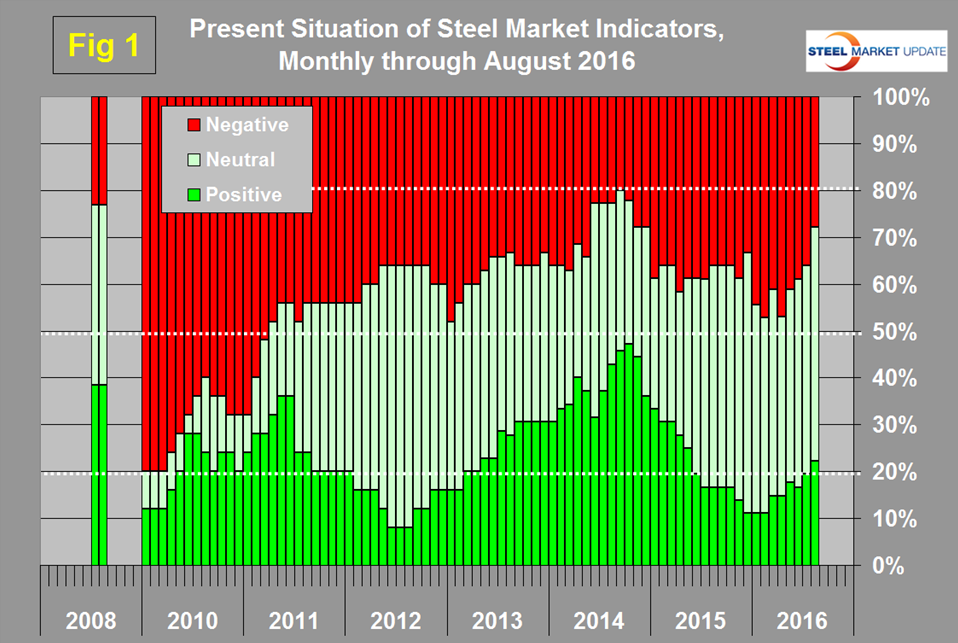
The number of indicators classified as positive peaked at 47.2 percent in October 2014 and steadily declined to 11.1 percent in the three months through last December. In 2016 there has been a gradual increase in the proportion of indicators that are currently positive and a decline of negatives. We currently still have a ho-hum present situation that has plenty of room for improvement. The real point that we are trying to identify is, “Which way is it going.”
Trends
Most values in the trends columns are three month moving averages to smooth out what can be very erratic monthly data. The proportion of indicators trending positive through August 26th was 52.8 percent with 38.9 percent trending negative and three indicators unchanged. Between December and May there was a surge in positives from 44.4 percent to 70.6 percent. Since May there has been a deterioration. Figure 2 shows the trend of the trends.
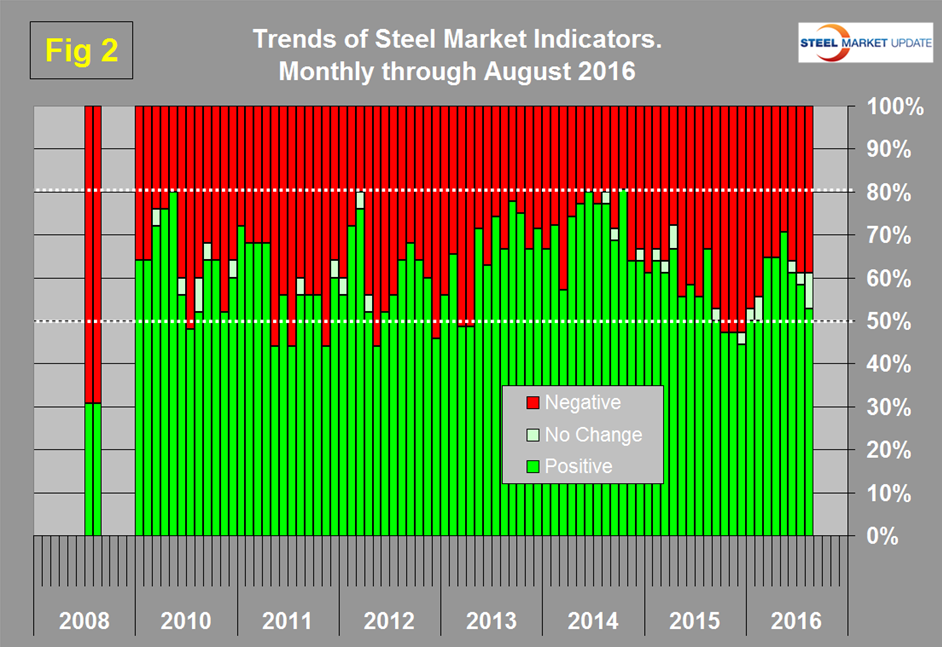
In October 2014 the proportion trending positive was 80.6 percent which coincided with the highest month of total steel supply since the recession. There was a steady deterioration through 2015. At the end of 2015 the proportion trending positive fell below 50 percent for the first time since March and April 2013. In 2016 the number of indicators trending positive peaked at 70.6 percent in May and now stands at 52.8 percent. Figure 2 shows the pre-recession situation at the far left of the chart. In August 2008 over 2/3, (69.2 percent) of our indicators were trending negative and the steel market crashed in September of that year.
Trend changes in the individual sectors since our last update on July 31st are described below. (Please note in most cases this is not August data but data that was released in August for previous months.)
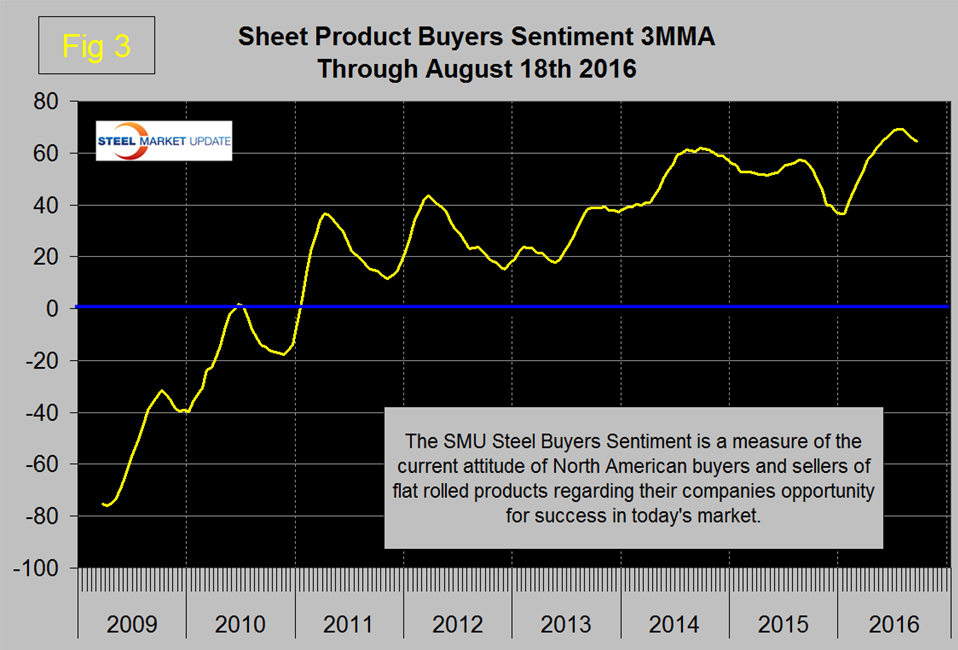
In the general economy, bank lending standards eased from a net 8.7 percent of banks tightening in the second quarter to a net 3.1 percent easing in the third quarter. In the SMU index section both are trending negative. Buyer sentiment continued to decline slightly but is still historically very strong (Figure 3).
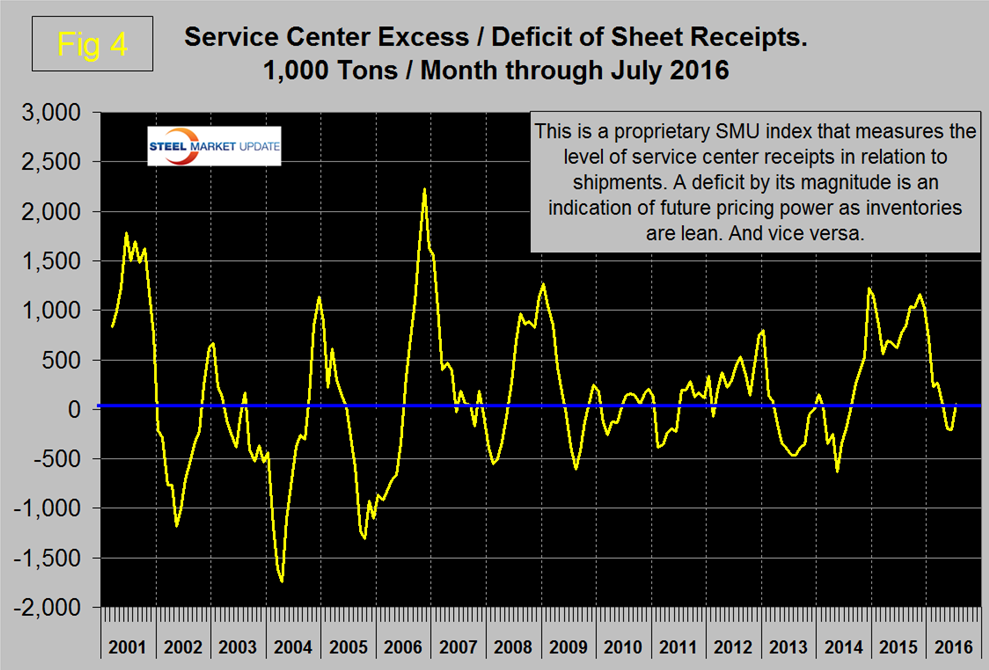
The service center excess inventory which is a proprietary SMU calculation reversed direction and had a slight surplus in July. We regard an inventory surplus to be a sign of weak pricing power but at present the surplus is so small as not to be an issue (Figure 4).
In the raw materials section the price of Chicago shredded was unchanged in August after declining in July. The price of iron ore reversed course in August and declined. Coking coal and zinc both continued to trend to higher prices. In the long products section shipments reversed course and trended down. The price of imported rebar was unchanged from July after previously declining. There were no changes in trends for the flat rolled steel section. In the construction section, infrastructure expenditures reversed course and trended down. Nonresidential building expenditures reversed course and trended up. There were no changes in the direction of trends in the manufacturing section.
Trends in the August data are reasonably encouraging though there has been a deterioration since May. This series is relatively stable therefore based on the data for the three months through August it looks as though we are back to where we were in the first half of 2015.
We believe a continued examination of both the present situation and direction is a valuable tool for corporate business planning.
Explanation: The point of this analysis is to give both a quick visual appreciation of the market situation and a detailed description for those who want to dig deeper. It describes where we are now and the direction in which the market is headed and is designed to give a snapshot of the market on a specific date. The chart is stacked vertically to separate the primary indicators of the general economy, of proprietary Steel Market Update indices, of raw material prices, of both flat rolled and long product market indicators and finally of construction and manufacturing indicators. The indicators are classified as leading, coincident or lagging as shown in the third column.
Columns in the chart are designed to differentiate between where the market is today and the direction in which it is headed. Our evaluation of the present situation is subjectively based on our opinion of the historical value of each indicator. There is nothing subjective about the trends section which provides the latest facts available on the date of publication. It is quite possible for the present situation to be predominantly red and trends to be predominantly green and vice versa depending on the overall situation and direction of the market. The present situation is sub-divided into, below the historical norm (-), (OK), and above the historical norm (+). The “Values” section of the chart is a quantitative definition of the market’s direction. In most cases values are three month moving averages to eliminate noise. In cases where seasonality is an issue, the evaluation of market direction is made on a year over year comparison to eliminate this effect. Where seasonality is not an issue concurrent periods are compared. The date of the latest data is identified in the third values column. Values will always be current as of the date of publication. Finally the far right column quantifies the trend as a percentage or numerical change with color code classification to indicate positive or negative direction.


