Market Data

August 30, 2016
Currency Update for Steel Trading Nations
Written by Peter Wright
The Federal Reserve Open Market Committee met on Friday, an event closely watched by currency traders around the world as they try to anticipate the Fed’s future interest rate activity. AllianceBernstein (AB) had this to say on Saturday. While Yellen’s main focus in Wyoming was on the tools needed to ensure a resilient monetary policy framework, she also provided a strong hint of September action: “…in light of the continued solid performance of the labor market and our outlook for economic activity and inflation, I believe the case for an increase in the federal funds rate has strengthened in recent months.” That’s a very direct statement – unusually so for the Fed leader. And it’s very different from her tone after the June Fed meeting, when she was still looking for assurances from the labor market that the economy’s momentum hadn’t fallen off. Since those remarks, two payroll reports have been released, with both showing strong initial job gains (292,000 in June and 255,000 in July).
We included this July 12th comment from Economy.com in our last update on July 21st and think it is worth repeating here: “Investors from all over the world buy Treasury bonds, and when deciding whether to invest they compare the risk-adjusted returns with those on other global assets. With yields on most European and Japanese bonds now firmly negative, given the aggressive bond buying by the European Central Bank, the Bank of Japan, and perhaps soon the Bank of England, US Treasuries appear very attractive. And in times of global stress, like now, they appear especially enticing, as they are far and away the safest investment in the world.”
On July 27th the IMF released their Policy Paper: External Sector Report Summary. We have included this as an appendix to this update for those subscribers who want to dig deeper into currency drivers.
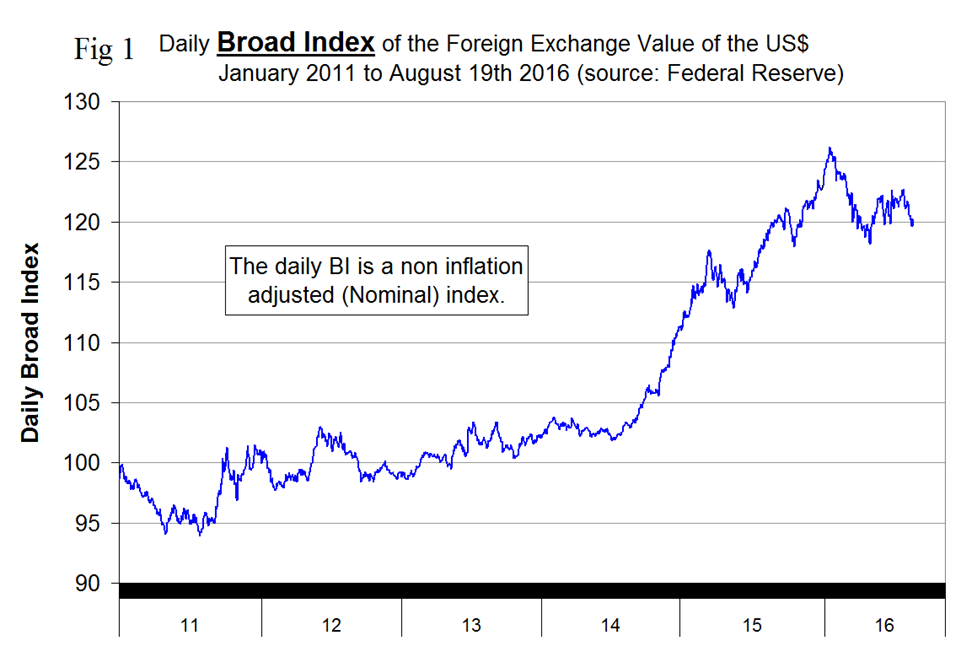
The Broad Index value of the US $ is reported several days in arrears, the latest value we have was dated August 19th (Figure 1).
The dollar had a recent high of 122.53 on July 26th and on August 19th had weakened to 120.19 which up to that date does not show a buying splurge by currency traders in anticipation of a September rate increase. In 30 days prior to August 19th the dollar weakened by 1.6 percent and in 7 days by 0.2 percent.
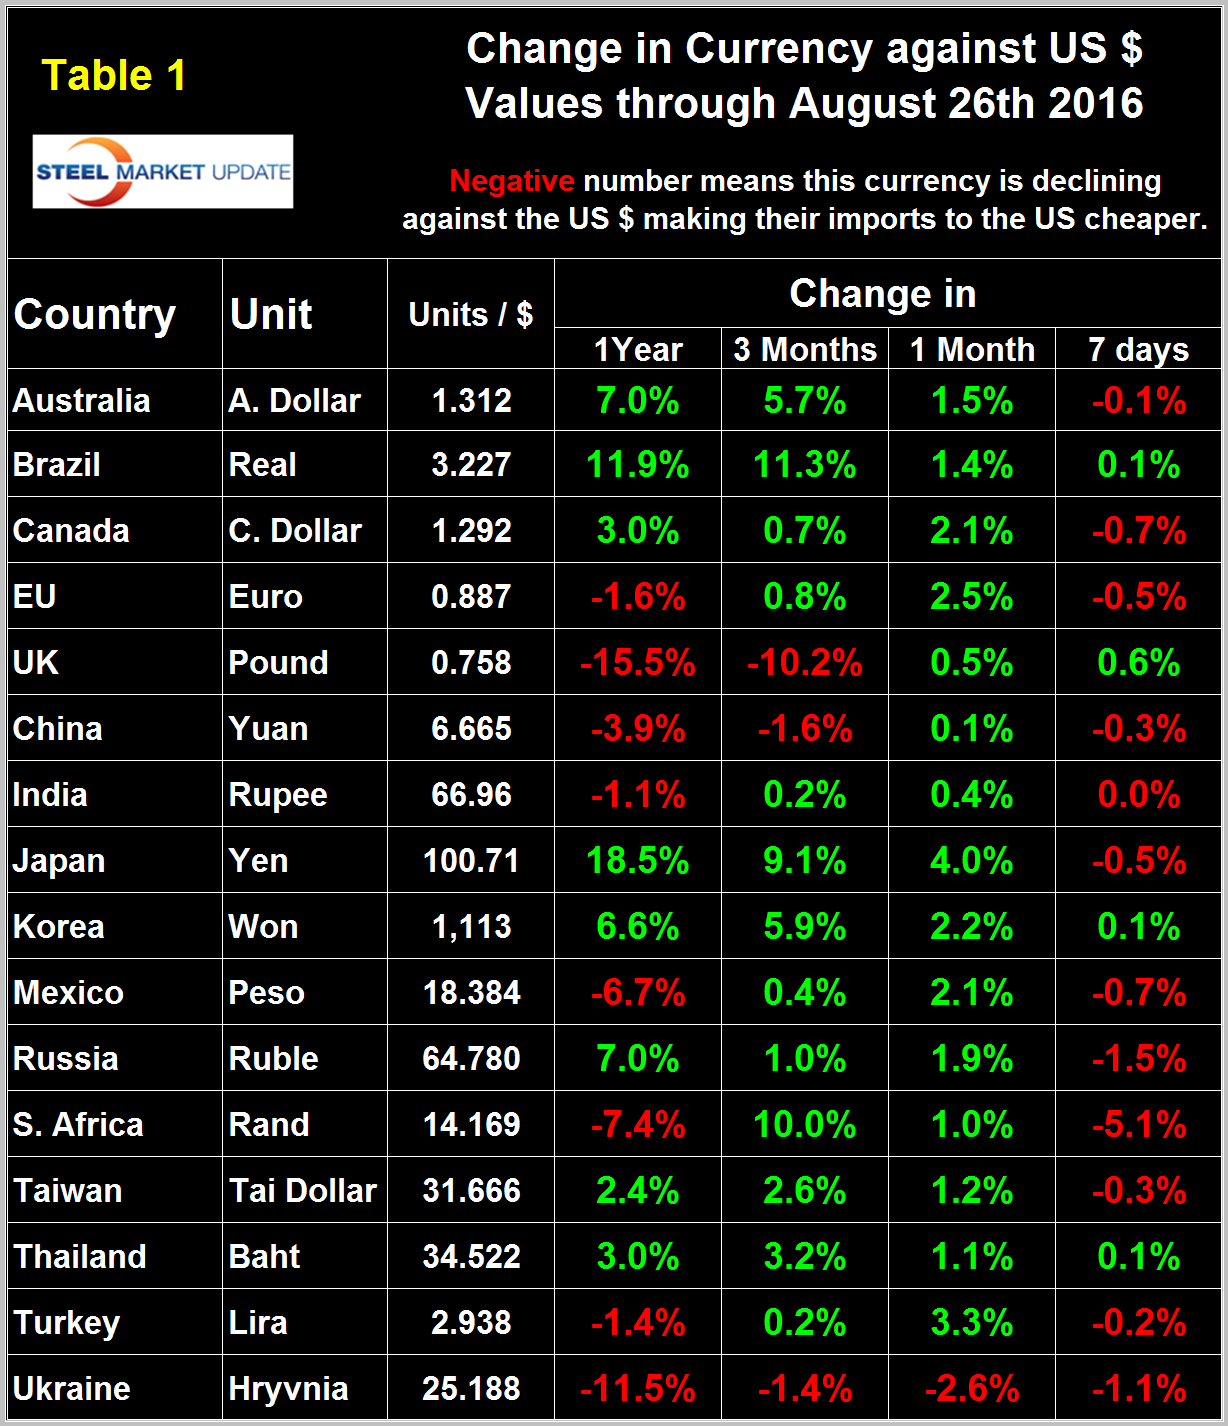
Table 1 shows the value of the US $ measured in the currencies of 16 steel and iron ore trading nations on August 26th, the day of the FOMC meeting in Wyoming. It reports the changes in one year, three months, one month and seven days for each currency and is color coded to indicate strengthening of the dollar in red and weakening in green. We regard strengthening of the US Dollar as negative and weakening as positive because the effect on net imports.
An estimated 25 percent of the U.S. economy had some involvement in international trade therefore currency swings can have a large effects on the economy in general and of the steel industry in particular. At the one month level there has been a quite substantial change in the value of the dollar since July 18th at which time the dollar in one month had weakened against nine of the sixteen currencies under consideration. In the most recent month the dollar weakened against every one of the 16 except Ukraine. At the seven day level shown in Table 1 there has been a reversal with the dollar strengthening against 12 of the 16. Maybe this is a sign of currency traders salivating over a possible September rate increase.
In each of these reports we comment on a few of the 16 steel trading currencies listed in Table 1. Charts for each of the 16 currencies listed in Table 1 are available through August 26th for any subscriber who requests them.
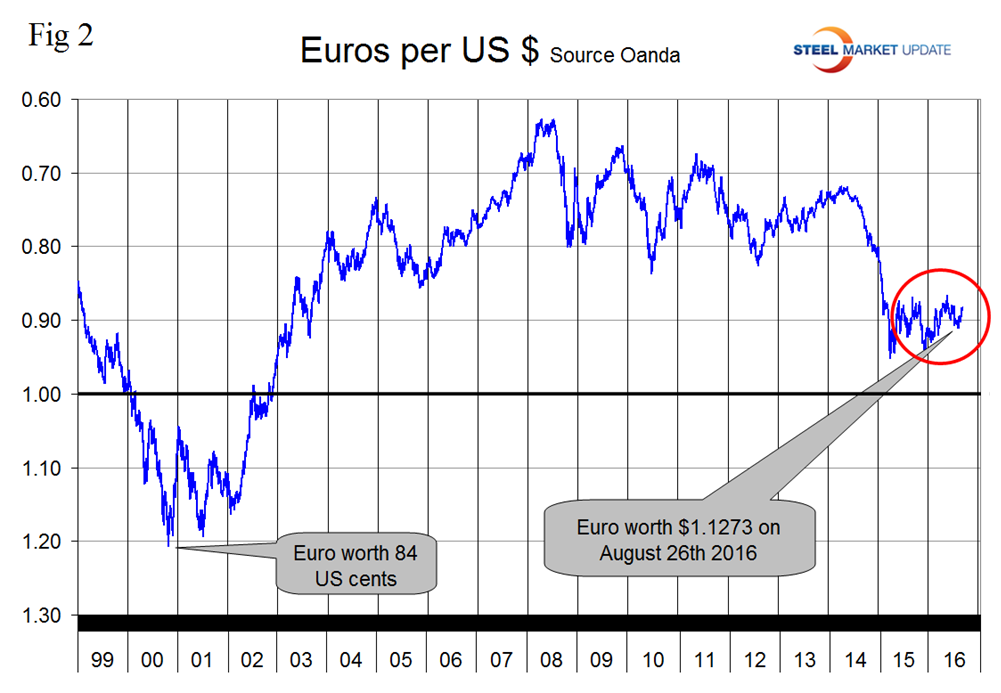
The Euro: On August 26th it took 1.1273 US dollars to buy one Euro (Figure 2). Through that date the Euro had strengthened by 2.5 percent in one month and weakened by 0.5 percent in 7 days. The Euro had a recent low of 1.0580 on November 30th last year.
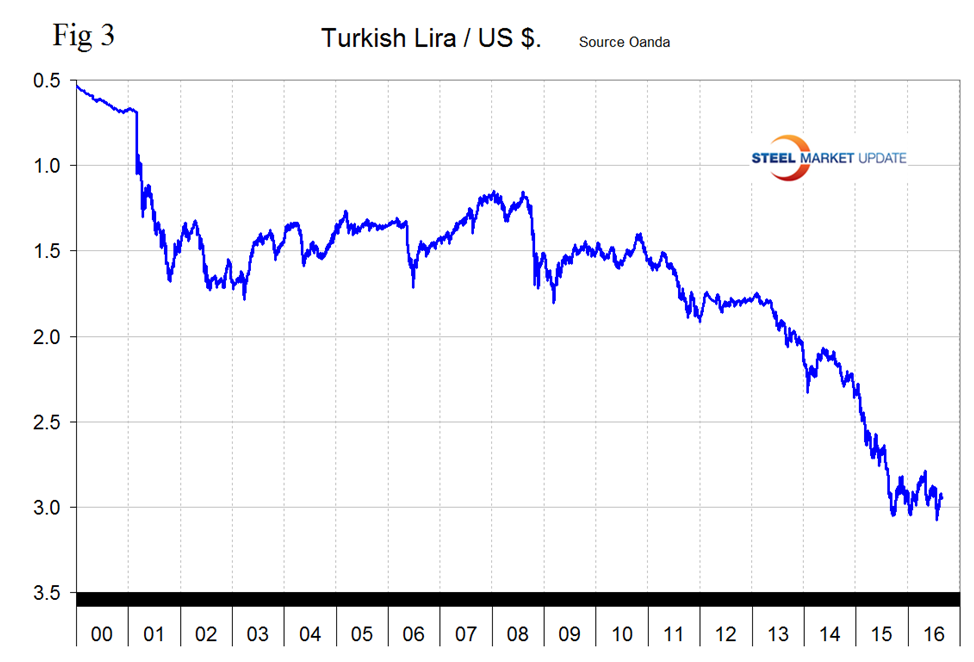
The Turkish Lira took a dive on news of the coup attempt to an all-time low of 3.076/US $ but has since recovered to 2.938 and is up by 3.3 percent in the last month and down by 0.2 percent in the last seven days (Figure 3).
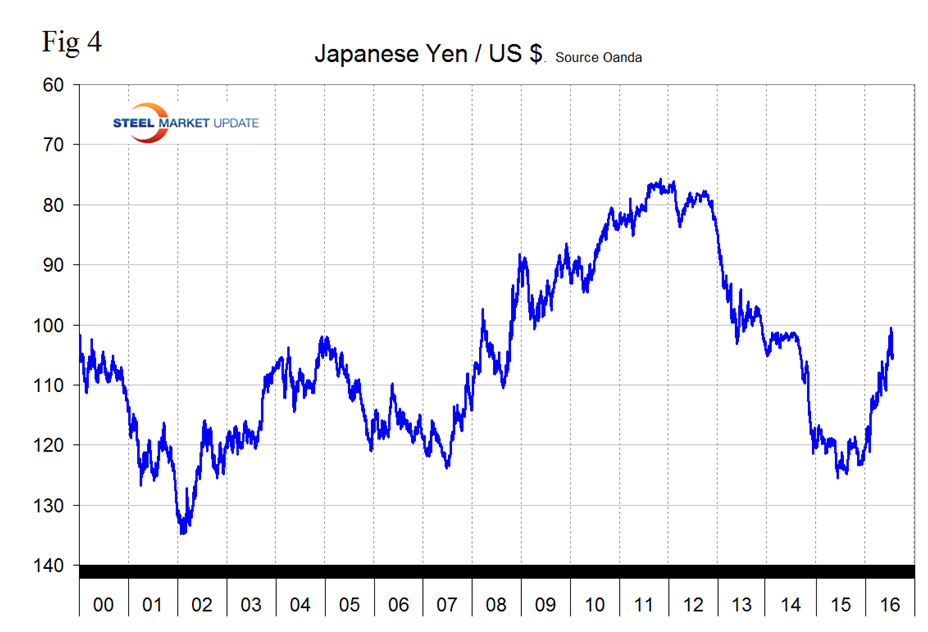
The Japanese Yen: Figure 4 shows the value of the Yen since January 2010. The Yen has been on a bull run for all of 2016 and this year has strengthened by 19.4 percent against the US dollar. The yen has appreciated by 4.0 percent in the last month and is down by 0.5 percent in seven days.
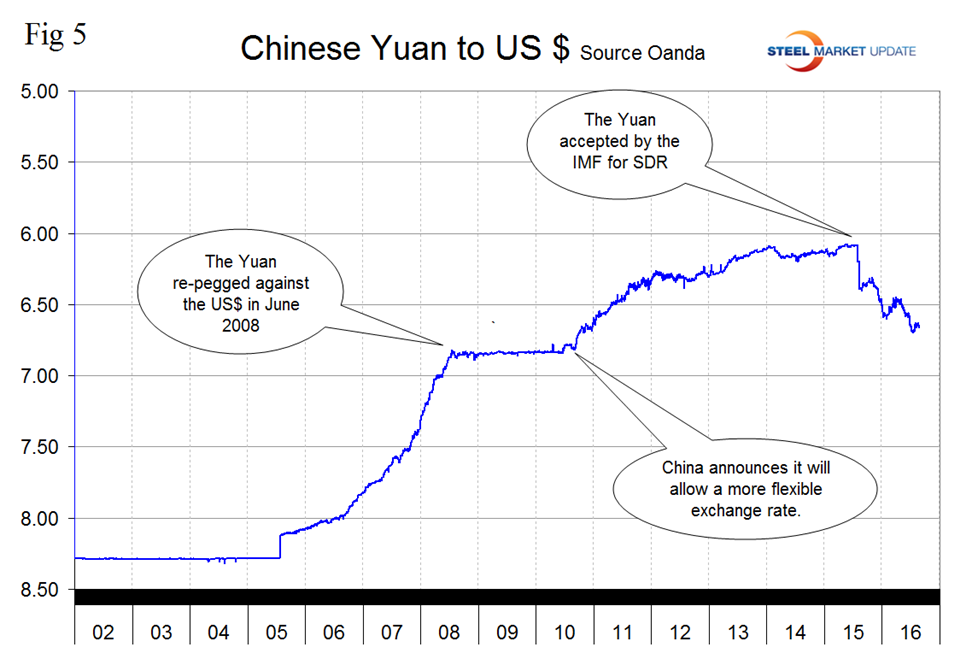
The Chinese Yuan has been in decline for a year now from a value of 6.0836 on June 22nd last year to 6.665 on August 26th, a decline of 8.7 percent (Figure 5). The Yuan was down by 0.3 percent in the last seven days.
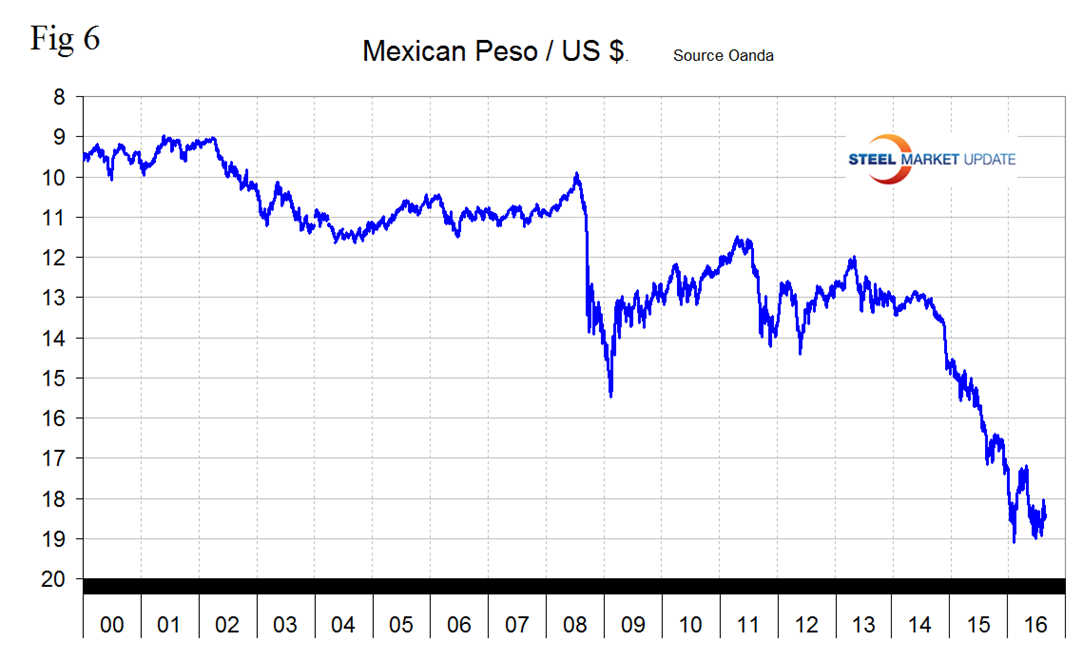
The Mexican Peso was at a rate of 18.38/US $ on August 26th which was down by 30.1 percent since May 25th 2014 (Figure 6). The Peso appreciated by 2.1 percent in the last month and depreciated by 0.7 percent in seven days.
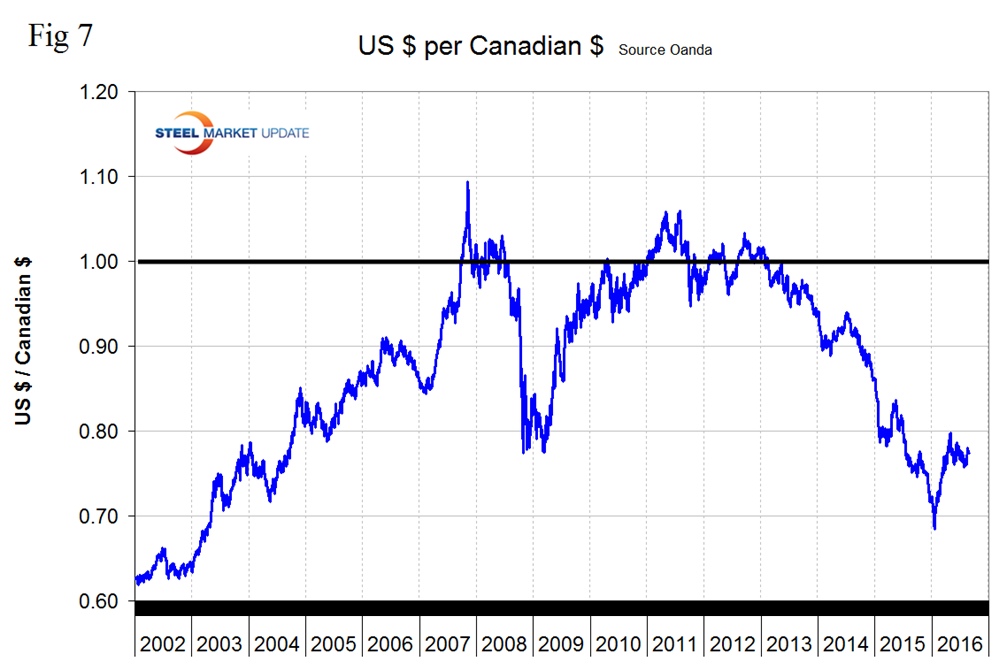
The Canadian Dollar was worth 77.4 US cents on August 26th, up by 2.1 percent in one month and down by 0.7 percent in seven days. The C $ had a recent low of 68.48 US cents on January 20th this year (Figure 7).
Explanation of Data Sources: The broad index is published by the Federal Reserve on both a daily and monthly basis. It is a weighted average of the foreign exchange values of the U.S. dollar against the currencies of a large group of major U.S. trading partners. The index weights, which change over time, are derived from U.S. export shares and from U.S. and foreign import shares. The data are noon buying rates in New York for cable transfers payable in the listed currencies. At SMU we use the historical exchange rates published in the Oanda Forex trading platform to track the currency value of the US $ against that of sixteen steel trading nations. Oanda operates within the guidelines of six major regulatory authorities around the world and provides access to over 70 currency pairs. Approximately $4 trillion US $ are traded every day on foreign exchange markets.
Appendix: IMF Policy Paper: 2016 External Sector Report Summary July 27, 2016: After narrowing in the aftermath of the global financial crisis and remaining broadly unchanged in recent years, global imbalances increased moderately in 2015, amid a reconfiguration of current accounts and exchange rates. Shifts in 2015 were driven primarily by the uneven strength of the recovery in advanced economies, the redistributive effects of the sharp fall in commodity prices, and tighter external financing conditions for emerging markets (EMs). A relatively stronger U.S. outlook led to a further appreciation of the USD and a depreciation of the yen and the euro. The sharp decline in commodity prices, reflecting both supply shocks and concerns about rebalancing and growth in China, brought about a significant redistribution of income from commodity exporters to importers, and a weakening of commodity exporters’ currencies. Meanwhile, heightened global risk aversion, contributed to softer capital inflows and depreciation pressures in many EMs.
This moderate widening of current account imbalances was largely driven by systemic economies. Surpluses in Japan, the euro area and China grew, supported by improved terms of trade and currency depreciation, while the current account deficit in the U.S. widened amid the steep appreciation of the USD. These widening imbalances were only partially offset by narrowing surpluses in large oil exporters and smaller deficits in vulnerable EMs and some euro area debtor countries.
Similarly, excess imbalances expanded in 2015. External positions in the U.S. and Japan moved from being broadly in line with fundamentals to being “moderately weaker” and “moderately stronger”, respectively. This was partly offset by a further narrowing of excess deficits in vulnerable EMs and euro area debtor countries. Meanwhile, excess surpluses persisted among the larger surplus countries, some of which remain “substantially stronger” than fundamentals (Germany, Korea).
Currency movements since end-2015 helped to partially reverse the trends observed last year, although market volatility following the result of the U.K. referendum to leave the European Union have led to a strengthening of the USD and yen along with a weakening of the sterling, euro, and EM currencies. The implications for external assessments going forward, especially for the U.K. and the euro area, remains uncertain and will likely depend on how the transition is managed and on what new arrangements are adopted.


