

Market Data

August 1, 2016
Key Market Indicators - July 31, 2016
Written by Peter Wright
An explanation of the Key Indicators concept is given at the end of this piece for those readers who are unfamiliar with it. It is important to understand the difference between our view of the present situation which is subjective and our analysis of trends which is based on the latest facts available.
![]() The total number of indicators considered in this analysis is currently 36.
The total number of indicators considered in this analysis is currently 36.
Please refer to Table 1 for the view of the present situation and the quantitative measure of trends. Readers should regard the color codes in the present situation column as a quick look at the current market condition. The “Trend” columns of Table 1, are also color coded to give a quick visual appreciation of the direction in which the market is headed. All data included in this table was released in July, the month or specific date to which the data refers is shown in the second column from the far right and all data is the latest available as of July 31st.
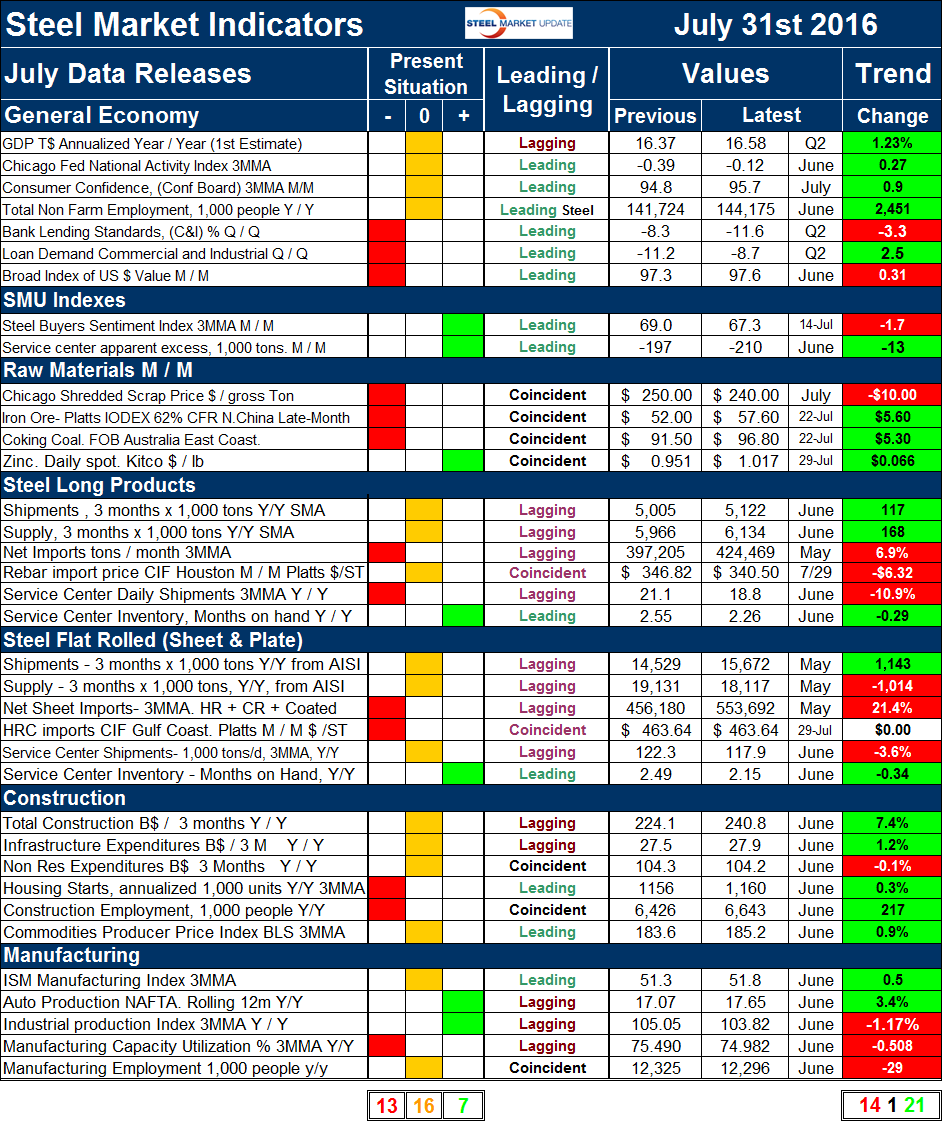
Present Situation
There was an increase of one in the net number of positive indicators and a decrease of one neutral since we last published on June 30th. There were several changes in the detail. Our intent in using the word neutral is to say that this indicator is considered to be in the mid-range of historical data. The Chicago Fed National Activity Index was upgraded from negative to neutral when the three month moving average (3MMA) of its value rose above -0.25. Manufacturing capacity utilization was downgraded from neutral to negative when its value fell below 75 percent. The price of zinc was upgraded from neutral to positive as it rose above $1.00/lb. There were no changes to the present situation of either of the steel sections or of construction indicators. We currently regard 7 of the 36 indicators to be positive, 16 to be neutral and 13 to be negative on a historical basis. The present situation of the general economy is considered to be neutral to weak with no indicators classified as strong. This week the first estimate of GDP in the 2nd Q was released and failed to meet analysts’ expectations (note the growth of GDP in this report is Y/Y not Q/Q as is the normal and misleading way of reporting). The SMU proprietary indexes are both historically strong. All the raw materials prices with the exception of zinc currently have a negative present situation. Indicators of the state of the long products market are similar to flat rolled. Shipments and supply of long products through June based on SMA data look similar to flat rolled through May based on AISI data (AISI reports lag the SMA).
Figure 1 shows the change in our assessment of the present situation since January 2010 on a percentage basis.
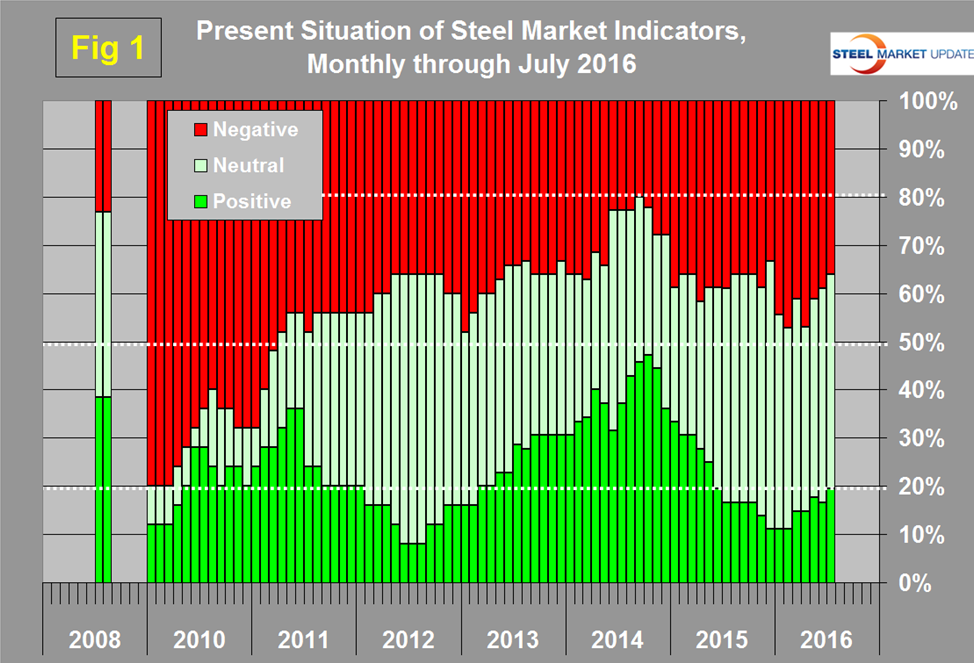
The number of indicators classified as positive peaked at 47.2 percent in October 2014 and steadily declined to 11.1 percent in the three months through last December. In 2016 there has been a gradual though uninspiring increase in the proportion of indicators that are currently positive and a decline of negatives. We currently still have a ho–hum present situation that has plenty of room for improvement. The real point that we are trying to identify is, “which way is it going?”
Trends
Most values in the trends columns are three month moving averages (3MMA) to smooth out what can be very erratic monthly data. The proportion of indicators trending positive through July 31st was 58.3 percent with 38.9 percent trending negative and one indicator unchanged. Between December and May there was a surge in positives from 44.4 percent to 70.6 percent. Since May there has been a deterioration. Figure 2 shows the trend of the trends.
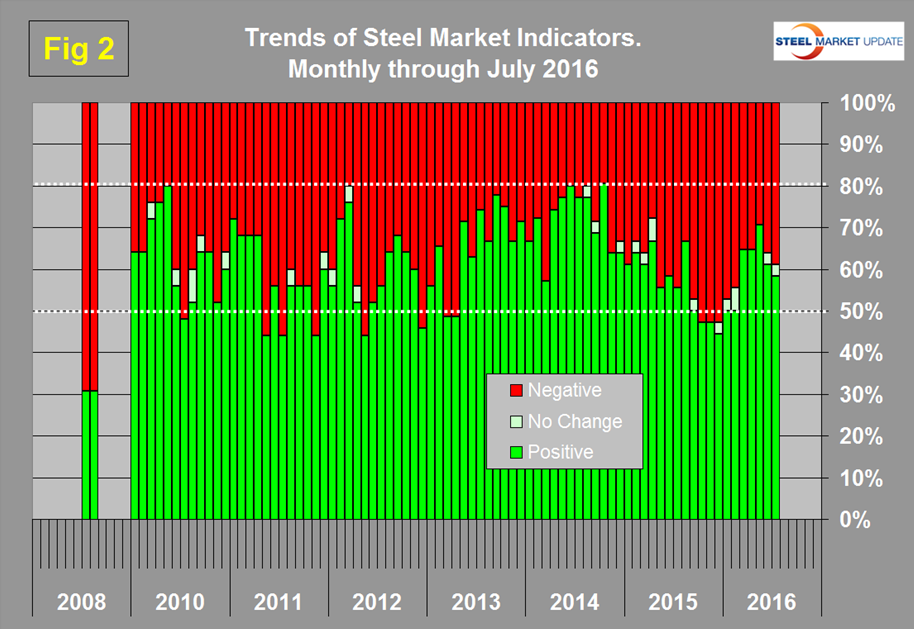
In October 2014 the proportion trending positive was 80.6 percent which coincided with the highest month of total steel supply since the recession. There was a steady deterioration through 2015. At the end of 2015 the proportion trending positive fell below 50 percent for the first time since March and April 2013. Figure 2 shows the pre-recession situation at the far left of the chart. In August 2008 over 2/3 (69.2 percent) of our indicators were trending negative and the steel market crashed in September of that year.
Changes in the individual sectors since our last update on June 30th are described below (please note in most cases this is not July data, but data that was released in July for previous months.)
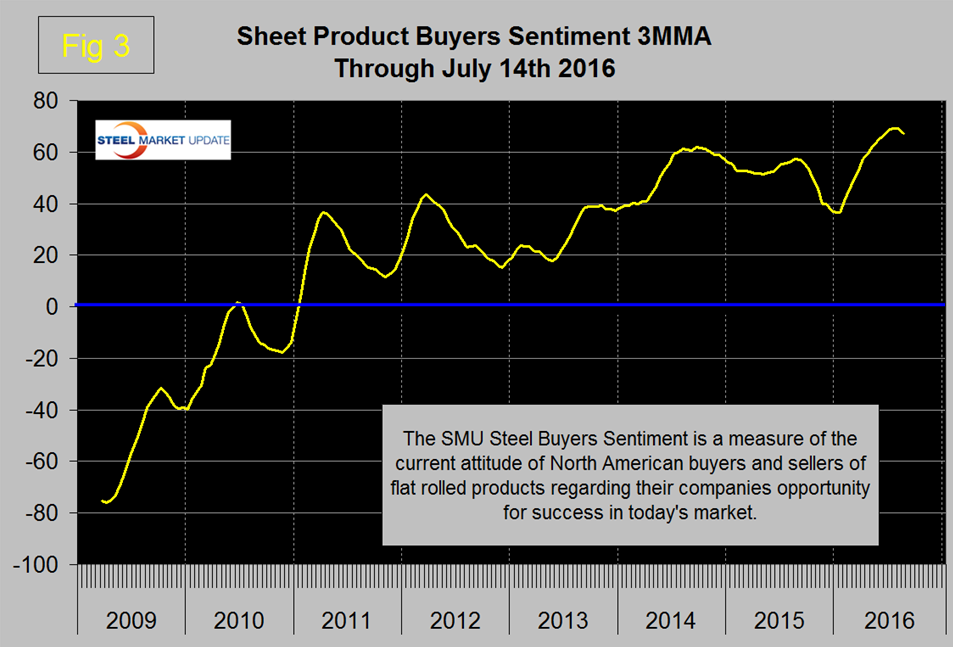
In the general economy, the Chicago Fed National Activity Index reversed direction and began to trend positive. There are two Steel Market Update proprietary indices in this report, both of which trended positive from December 31st through our last update on June 30th. In July the steel buyer’s sentiment index reversed direction and declined from its all-time high of 69.17 at the end of June to 67.33 on July 14th. This is still historically excellent as shown in Figure 3.
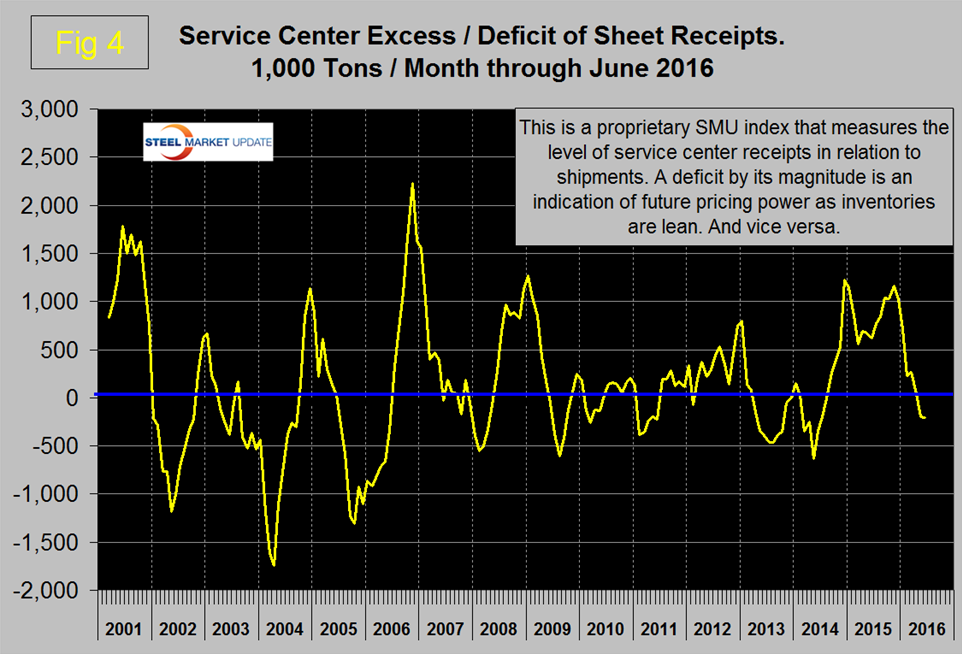
The calculation of service center sheet product excess inventory has declined from over a million tons in the last four months of 2015 to a deficit of 210,000 tons in June. A high excess is indicative of low pricing power therefore we regard this trend as extremely positive (Figure 4).
In the raw materials price section, the price of iron ore delivered North China reversed course and rose from $52.00/dmt in late June to $57.60 on July 22nd. The price of coking coal continues to increase and the surging price of Zinc continued through July (see our raw materials price article published this week).
In the long product section net imports reversed course and increased in May, there were no other changes in the direction of trends. In the flat rolled section there were no changes in trend direction since our June 30th update. In the construction section all indicators flashed green at the end of June but in July nonresidential building expenditures as reported in the Commerce Department CPIP report reversed course and contracted. This is of concern because the construction starts data reported by Dodge Analytics has been indicating contraction since April last year and this may now have percolated down to actual consumption of steel products. There was no change in the direction of manufacturing trends. The only indicator that we consider to be “leading” in manufacturing is the ISM index and this has been trending positive now since our February update.
Trends in the July data continue to be encouraging though they retreated from the May and June releases. This series is relatively stable therefore based on the data for the first six months of 2016 we conclude that the improvement over last year is for real and that a positive shift in the market is occurring.
We believe a continued examination of both the present situation and direction is a valuable tool for corporate business planning.
Explanation: The point of this analysis is to give both a quick visual appreciation of the market situation and a detailed description for those who want to dig deeper. It describes where we are now and the direction in which the market is headed and is designed to give a snapshot of the market on a specific date. The chart is stacked vertically to separate the primary indicators of the general economy, of proprietary Steel Market Update indices, of raw material prices, of both flat rolled and long product market indicators and finally of construction and manufacturing indicators. The indicators are classified as leading, coincident or lagging as shown in the third column.
Columns in the chart are designed to differentiate between where the market is today and the direction in which it is headed. Our evaluation of the present situation is subjectively based on our opinion of the historical value of each indicator. There is nothing subjective about the trends section which provides the latest facts available on the date of publication. It is quite possible for the present situation to be predominantly red and trends to be predominantly green and vice versa depending on the overall situation and direction of the market. The present situation is sub-divided into, below the historical norm (-) (OK), and above the historical norm (+). The “Values” section of the chart is a quantitative definition of the market’s direction. In most cases values are three month moving averages to eliminate noise. In cases where seasonality is an issue, the evaluation of market direction is made on a year over year comparison to eliminate this effect. Where seasonality is not an issue concurrent periods are compared. The date of the latest data is identified in the third values column. Values will always be current as of the date of publication. Finally the far right column quantifies the trend as a percentage or numerical change with color code classification to indicate positive or negative direction.


