Market Data

April 27, 2016
Currency Update for Steel Trading Nations
Written by Peter Wright
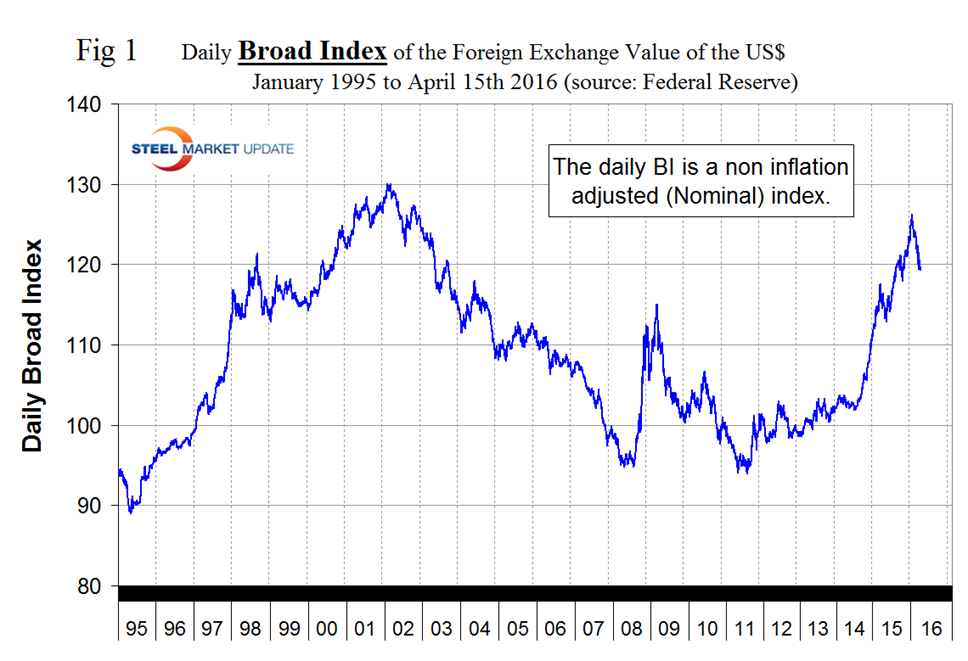
The Broad Index value of the US $ peaked on January 20th at 126.2, and on April 15th (latest figure available) was rated at 119.7, a decline of 5.2 percent. This is the lowest value since November 3rd 2015 (Figure 1).
On March 15th the Fed held rates constant and cut its projection for the number of hikes this year from four to two, pointing to “global economic and financial developments” that will keep inflation low for the remainder of 2016. The announcement sent the dollar plummeting, and the currency continued to drop sharply overnight to an almost three-week low against the yen.
John Mason provided some background on February 23rd that we thought would be worth including here: United States leaders have been talking as if they want a strong dollar for most of the past 60 years. Yet, most of the time, they have acted in just the opposite direction. The economic policies that began in the early 1960s resulted in the United States going off the gold system in 1971 and then floating the value of the US dollar in the foreign exchange markets. From January 1973 to August 2011, the index of the value of the US dollar against major currencies dropped by 36 percent. Since the summer of 2011, the rest of the world has done almost everything it can to make the value of the US dollar stronger and, as a consequence, the dollar has risen by 38 percent. The emerging nations of the world prospered during the economic recovery. Money flowed from the US into the world commodity bubble as a result of the Federal Reserve’s three rounds of quantitative easing. This situation has reversed itself since the Federal Reserve ended quantitative easing at the end of October 2014 and the value of the emerging market currencies against the US dollar fell drastically until January 2016.
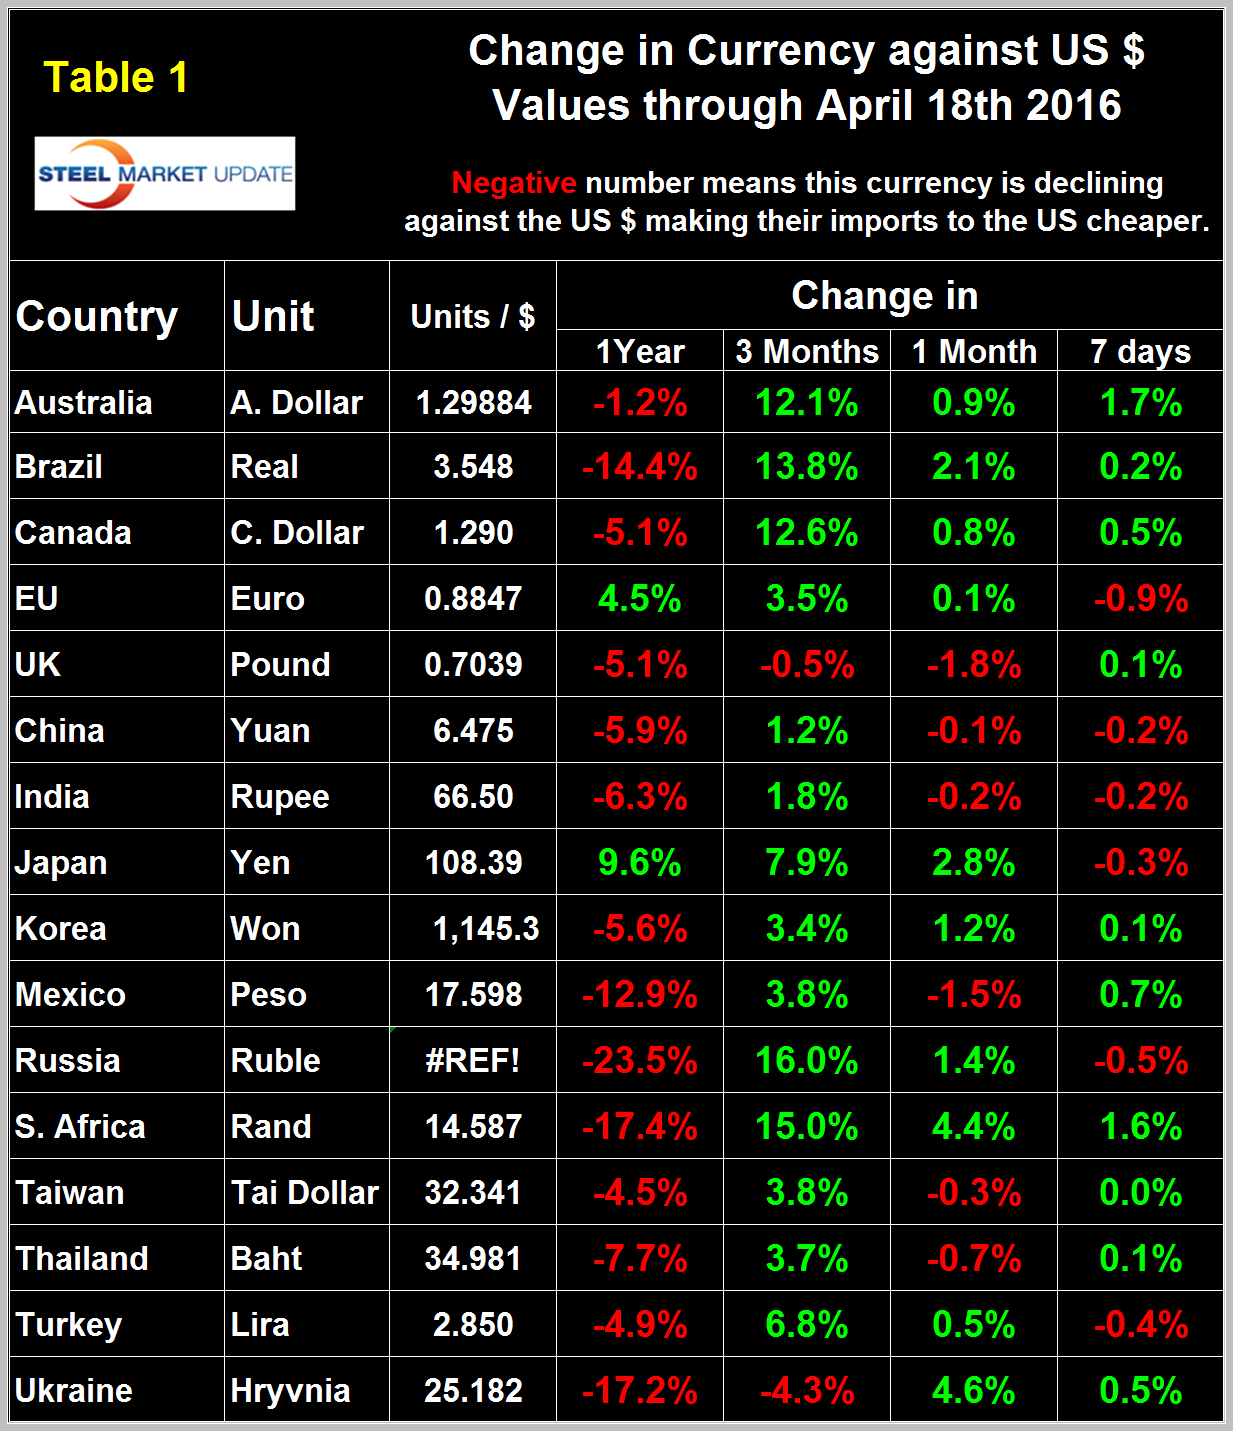
Table 1 shows the change in currencies of 16 steel and iron ore trading nations in one year, three months, one month and seven days for each currency and is color coded to indicate strengthening of the dollar in red and weakening in green.
We regard strengthening of the US Dollar as negative and weakening as positive because the effect on net imports. An estimated 25 percent of the U.S. economy had some involvement in international trade therefore currency swings can have a large effects on the economy in general and of the steel industry in particular. In our January 25th update the dollar strengthened against 15 of the 16 currencies under consideration at the 3 month level as traders increased their dollar positions to obtain a better return on their assets. In our February 21st update the $ strengthened against 14 of 16 at the 3 month level and in this April 19th update the $ the dollar did a complete reversal and weakened against 14 of the 16 steel and raw materials trading currencies. In effect the “green” has moved across our table from being predominant at the 7 day level on December 25th to the 1 month level on February 21st and to the 3 month level on April 18th. It looks as though currency traders over bought the dollar and then decided to reduce their positions based on the Fed’s dovish projections for rate increases in the balance of 2016. Looking at the 7 day level in this latest data the dollar is still weakening against 10 of the 16 steel trading currencies meaning that the trend is still ongoing. Figure 1 suggests that this recent weakening is a fairly significant move in a historical context.
In each of these reports we comment on a few of the 16 steel trading currencies listed in Table 1 and include extracts from sources that we have come across that we deem credible. Charts for each of the 16 currencies listed in Table 1 are available through April 18th for any reader who requests them.
The Euro
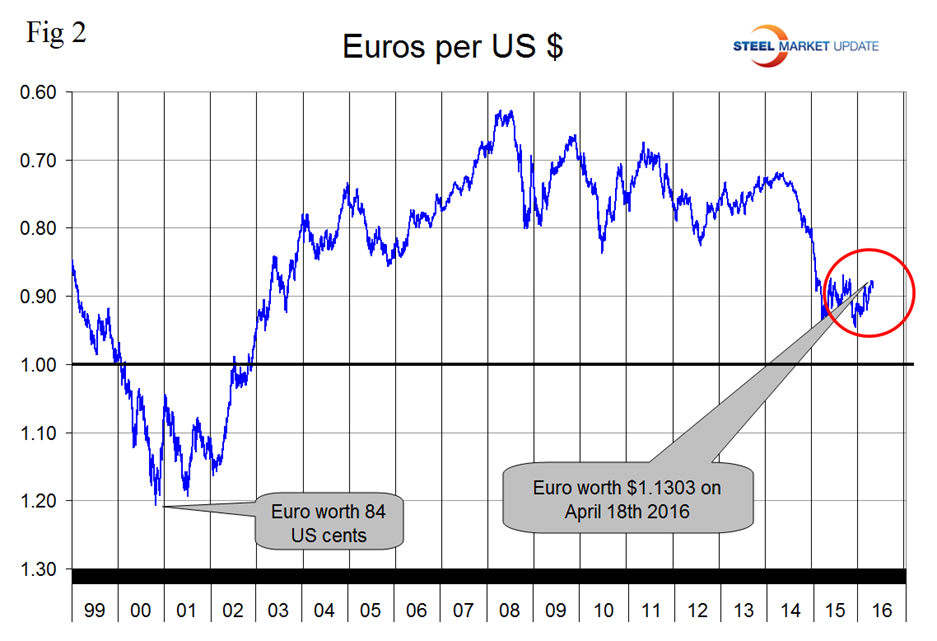
On April 18th it took 1.1303 US dollars to buy one Euro (Figure 2).
Through that date the Euro had strengthened by 3.5 percent in three months and by 0.1 percent in the last 30 days. The Euro had a recent low of 1.0580 on November 30th. The euro has been trading in a range for over a year now as traders compare the monetary policy activities of the Fed and the ECB.
On April 11th Kenny Fisher wrote: The ECB has pumped some EUR 700 billion into its asset-purchase program, but the results have been disappointing, as the Eurozone continues to grapple with weak growth and inflation levels. Minutes of the ECB Governing Council indicated that members were broadly unified behind ECB president Mario Draghi, supporting the monetary package which the ECB adopted at the March meeting. The minutes acknowledged the difficult situation of the Eurozone economy, noting that the pace of recovery is expected to remain weak and uncertainties in the global economic environment pose significant risks to the Eurozone. Governing Council members also called for structural reforms, a theme that has often been mentioned by Draghi. The main refinancing rate was cut from 0.05 percent to a flat 0.0 percent. After the announcement of these measures, Draghi added that he did not anticipate further rate cuts in the near future. This could be a signal that the ECB has given up on trying to stimulate growth through a lower euro by adopting negative rates.
The Japanese Yen
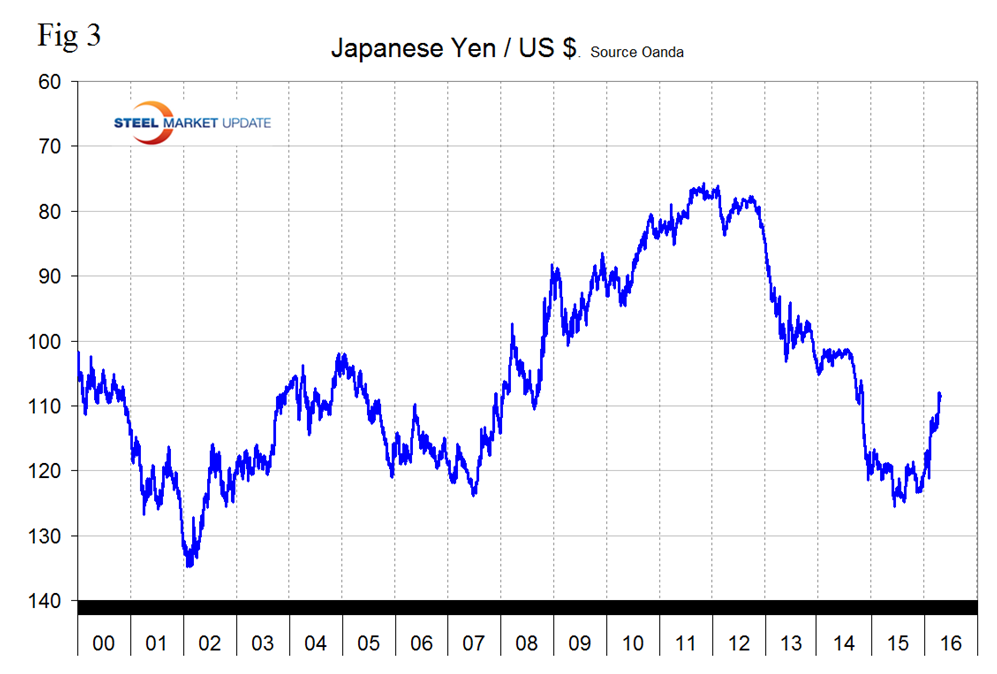
Figure 3 shows the value of the Yen since January 2000.
The Yen has strengthened by 7.9 percent in 3 months and 2.8 percent in the last 30 days to close at 108.39/US $ on April 18th. The Yen is now stronger than at any time since October 31st 2014. Japan released the Tankan Manufacturing and Non-manufacturing indices for the first quarter last week, key indicators which are similar to PMI reports. Both indicators lost ground missed their estimates. The Tankan Manufacturing Index slipped to 6 points, its weakest reading since 2013. Analysts attributed the drop to weaker demand for Japanese exports, coupled with a sharp appreciation in the yen. Non-Manufacturing Index followed suit, as domestic spending as dipped. The index dropped to 22 points, its smallest gain in four quarters. The soft readings will undoubtedly raise concerns at the Bank of Japan, which is under pressure to make some monetary moves at its policy meeting in April in order to kick-start the weak economy.
The Chinese Yuan
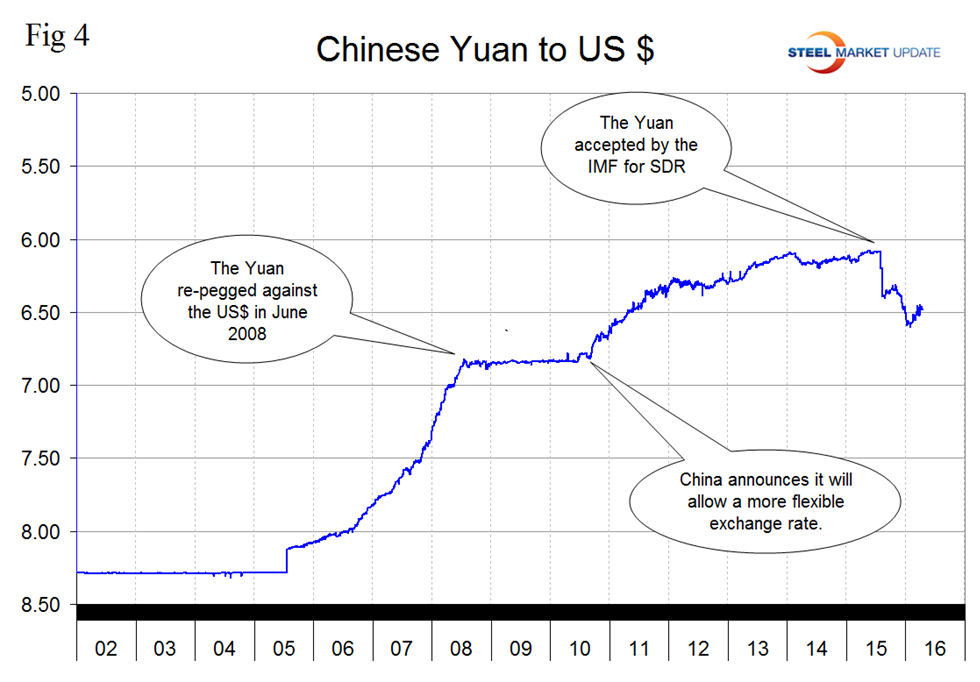
Figure 4 shows the history of the Yuan against the US $ since January 2002.
In the last three months the Yuan has strengthened by 1.2 percent but has weakened by 0.1 percent in the last 30 days. Following the devaluation in August the Yuan bottomed out at 6.4028 on August 27th. Then it recovered to 6.3185 on October 31st bottomed out again on January 9th at 6.5907 and has since recovered to 6.475 on the 18th.
On February 23rd John Mason wrote: China has made its own contribution to the strength of the US dollar as it has struggled to get its currency accepted in world trade as a reserve currency. This was finally achieved in 2015, but in August 2015, the Chinese also devalued their currency, resulting in a rise in the value of the US dollar. Now, China is facing additional headwinds as it attempts to reduce the outflows of reserve currencies. The dilemma China faces is whether or not to further devalue the renminbi or introduce capital controls that would constrain the reserve currency outflows. It would choose one or the other of these two choices in order to maintain control of its domestic monetary policy. The best guess is that China will not put on capital controls and therefore will have to accept further devaluation of its currency. This seems to be what several hedge fund managers are betting on these days.
The Canadian Dollar
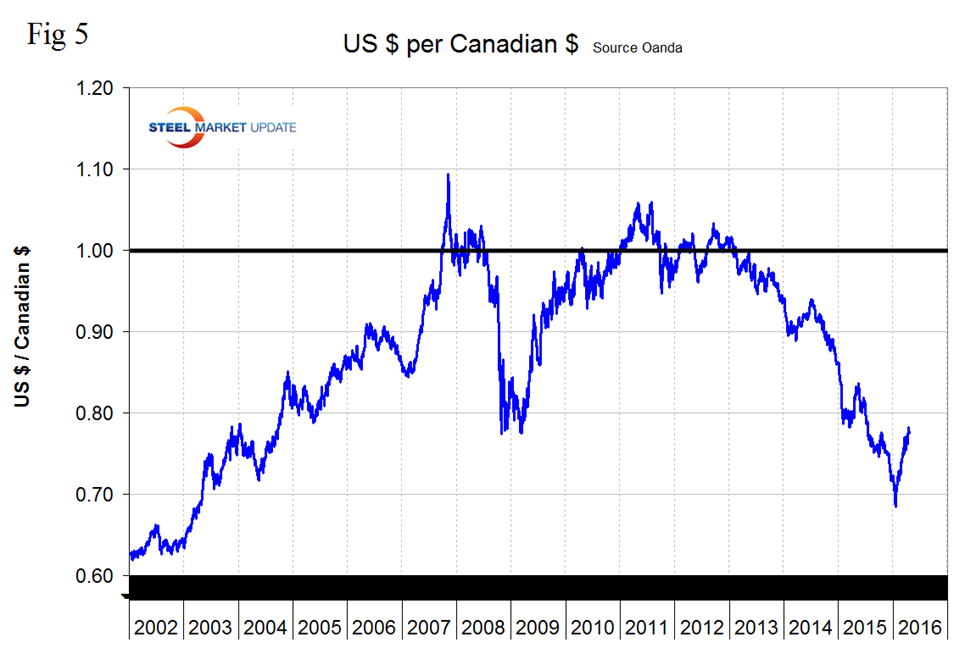
Figure 5 shows the value of the C$ since January 2002.
In the three months before April 18th the C$ has appreciated by 12.6 percent and by 0.8 percent in the last 30 days.
On April 6th Dr. Ahanotu wrote: Canada’s GDP report for January, 2016 confirmed renewed strength in the Canadian economy. Real GDP grew 0.6 percent month-over-month which represented the fourth month in a row of gains. Growth in goods-producing industries outshone service-producing industries to the tune of 1.2 percent to 0.4 percent month-over-month in another sign that the weakening in the Canadian dollar had its intended impact of boosting export-dependent industries Now that the Canadian economy has apparently stabilized, the weakening in the Canadian dollar has come to a dramatic end. I argued last month that “the Bank of Canada is done with rate cuts.” The rapid reflation of the Canadian dollar coupled with Canada’s improving economic performance seem to confirm that the Bank of Canada is running out of excuses for outright dovishness…except of course to try to encourage traders to get back to shorting the currency. The Currency is up an impressive 11 percent from the January and the breakout above resistance at the 200-day moving average is even more impressive…and bullish.
The Mexican Peso
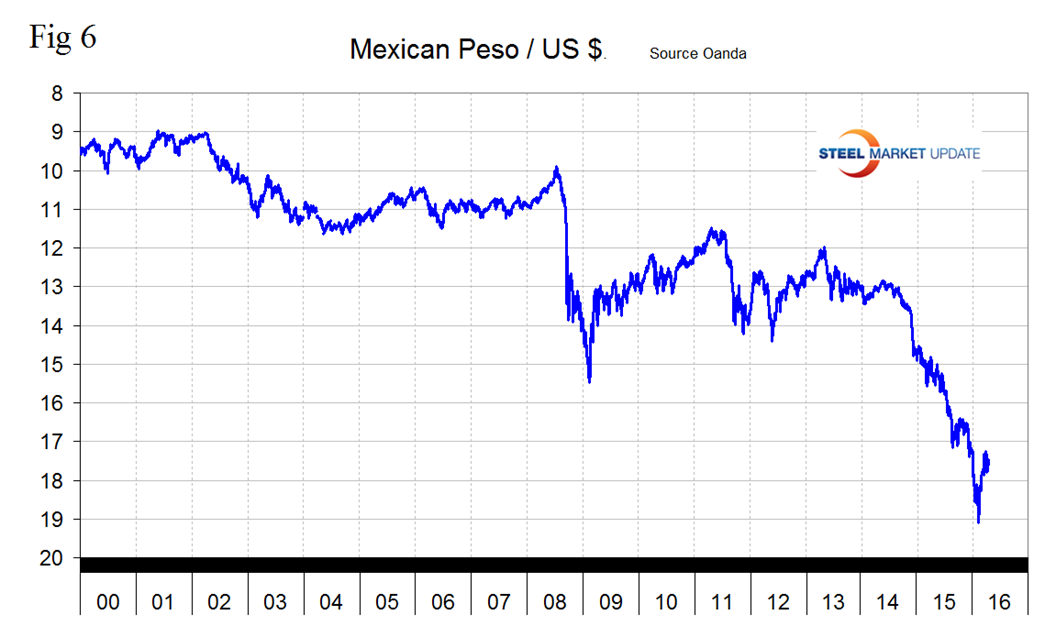
Figure 6 shows the value of the Peso since January 2000.
In the three months before April 18th the Peso appreciated by 3.76 percent but gave back 1.5 percent in the last 30 days.
The Russian Ruble
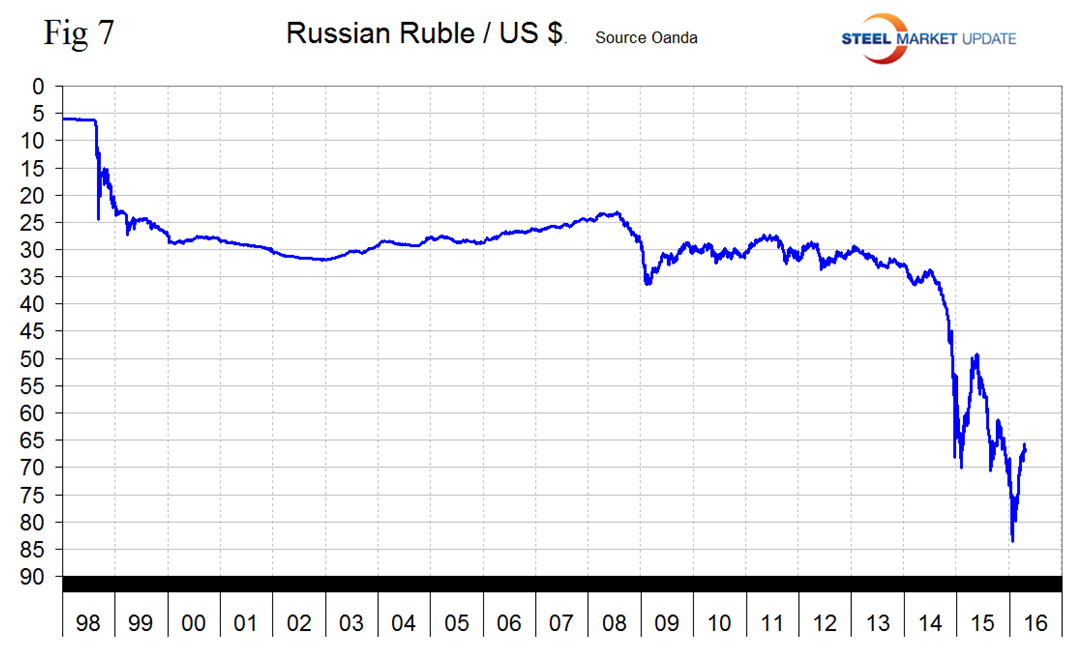
Figure 7 shows the value of the Russian Ruble since January 1998.
In the three months before April 18th the Ruble appreciated by 16.0 percent and by 1.4 percent in the last 30 days.
On April 7th Oleh Kombaiev wrote: As expected, the tight monetary policy of the Central Bank of Russia and correction of oil prices allowed the ruble to win back a part of its lost value after the collapse in early 2016. But, in my opinion, further interest rate retention at the current, relatively high level brings the risk of further contraction in already dangerously low business activity. Therefore, most likely, in April, the Central Bank of Russia will agree to the rate cut, which will create momentum for a weakening of the ruble. The Central Bank of Russia has held interest rates at 11 percent since August 2015. The devaluation of the ruble as a consequence of the drop in oil prices from October 2015 to January 2016 (Figure 7), impacted the growth of inflation and inflation expectations. In the periods of the maximum volatility of the ruble exchange rate in December 2015 the Central Bank resorted to the restraint of the ruble REPO auction limits that allowed to stimulate the demand for ruble within the financial system, without increasing interest rates. As a result, the inflation situation stabilized — relatively speaking. According to the statistics service of Russia, inflation in March 2016 amounted to 0.5 percent m/m (0.6 percent m/m in February 2016) and 7.3 percent y/y (8.1 percent y/y in February 2016). This was due partly to the fact that the real incomes of the Russian citizens has been declining continuously since November 2014. This results in falling effective demand and retail turnover.
Explanation of Data Sources: The broad index is published by the Federal Reserve on both a daily and monthly basis. It is a weighted average of the foreign exchange values of the U.S. dollar against the currencies of a large group of major U.S. trading partners. The index weights, which change over time, are derived from U.S. export shares and from U.S. and foreign import shares. The data are noon buying rates in New York for cable transfers payable in the listed currencies. At SMU we use the historical exchange rates published in the Oanda Forex trading platform to track the currency value of the US $ against that of sixteen steel trading nations. Oanda operates within the guidelines of six major regulatory authorities around the world and provides access to over 70 currency pairs. Approximately $4 trillion US $ are traded every day on foreign exchange markets.


