Prices
February 10, 2016
Ferrous Scrap Exports through December Down 9.7% YOY
Written by Peter Wright
In the twelve eleven months of 2015 bulk scrap exports were 12,955,000 metric tonnes, down by 9.7 percent from 2014 (14,280,000 net tons). The tonnages shown in Figure 1 are based on three month moving averages (3MMA) for 2015 and on the annual monthly average for previous years.
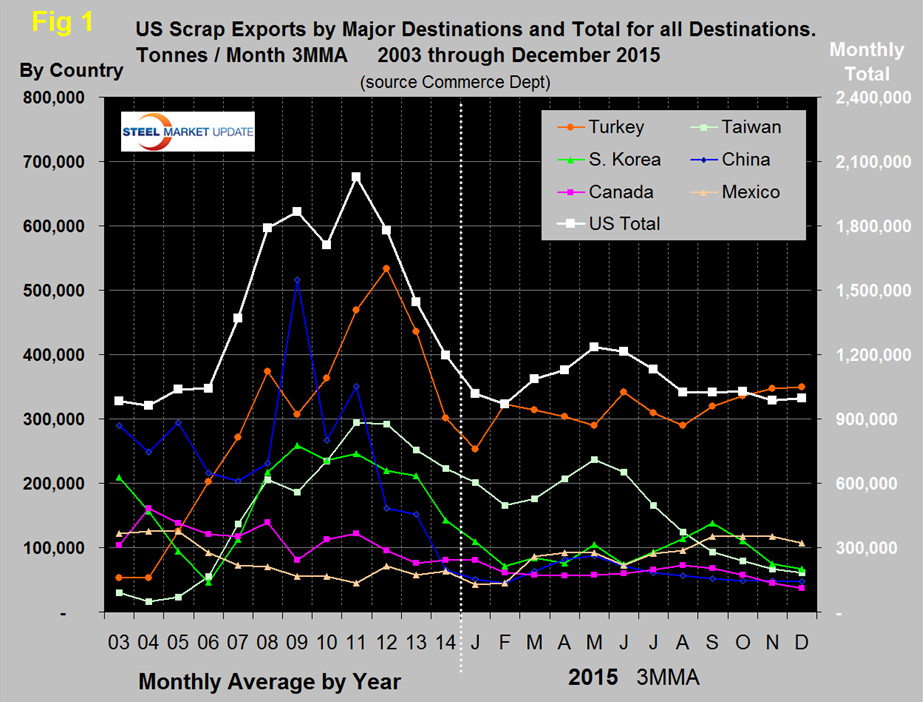
The graph shows that exports declined for three consecutive years, 2012 through 2014 continuing through January and February this year. March saw a trend reversal that continued through May followed by three months of decline. The August, September and November tonnages were almost exactly the same on a 3MMA basis then the decline continued in November and the level stayed constant in December. Exports in the single month of November were the lowest since January 2006. In 2014, scrap exports totaled 14,345,000 tonnes, down by 17.3 percent from 2013.
In the single month of December, Turkey was the major destination with 463,000 tonnes, followed by Mexico with 123,000 tons and India with 117,000 tonnes. Turkey had the highest volume in 11 out of 12 months in 2015 for a total of 3,969,000 tonnes. Taiwan took 1.6 million, Mexico 1.15 million and India and South Korea both took 1.1 million tonnes.
We came across some almost unbelievable data on the Turkish steel industry this week but the source is good, explains a lot and supports some of our recent comments in other articles about the relative value of scrap and iron ore. According to the Turkish Steel Producers Association the capacity utilization rate of Turkey’s EAFs dropped by almost 10 percent to 51.7 percent in 2015, as Turkish BOFs’ capacity utilization increased by 6.5 percent to 95.5 percent. The discrepancy between the iron ore price and the price of scrap made BOF production more attractive. China has the same situation except that their industry is 93 percent BOF and they have flooded Turkey and others with low cost Chinese billets.
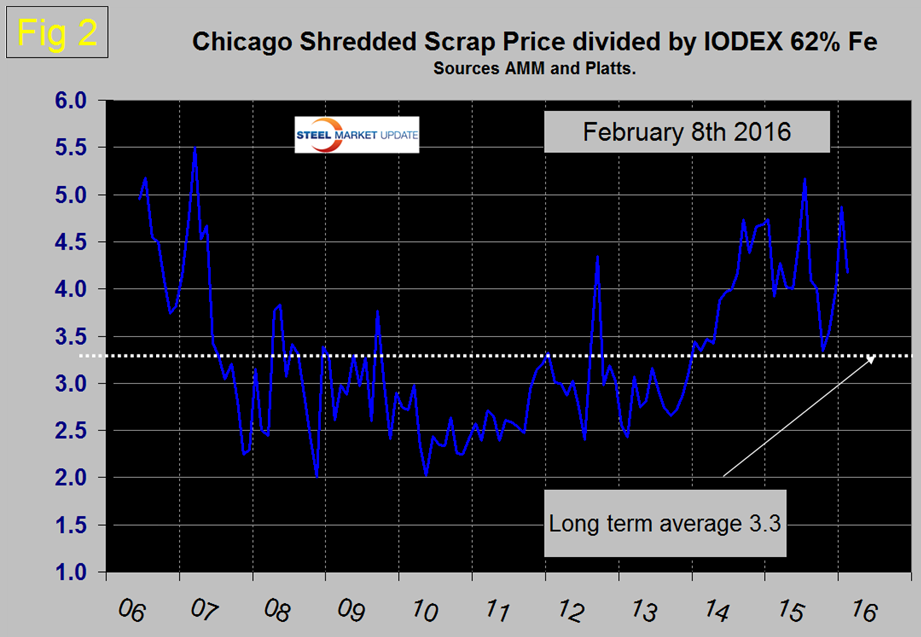
Imports of CIS and Brazilian slab made the scrap situation worse. Billet and bloom imports rose by 45 percent and 83 percent to 1.8million tonnes and 3.1million tonnes, respectively in 2015, while slab imports increased by over 61 percent to 2.9 million tonnes. Semi-finished imports will continue to be favored by Turkish mills until either the scrap price declines or iron ore bounces back. On December 4th iron ore broke through $40 heading down and reached $39.40/dmt. On February 8th the ore price had recovered to $45.50/dmt. The long term average ratio between the price of scrap and ore is a multiple of 3.3, but since mid-2014 with one short exception the ratio has been >4.0 (Figure 2) which continues to be advantageous to the integrated producers and China in particular.
US scrap exports to the Far East in 2015 were down by 38.1 percent year over year as the depreciated Yen allows Japan to pick up share in that region. Exports to Canada were down by 31.2 percent and to Mexico were up by 51.6 percent. India became a big player in 2015 and their tonnage out of the US has put them in 4th place as a destination, up by 97.7 percent year over year. Exports to South Korea and Taiwan were down by 36.1 percent and 38.7 percent respectively. Shipments to China in 2015 were 699,000 tonnes, down by 11.0 percent year over year.
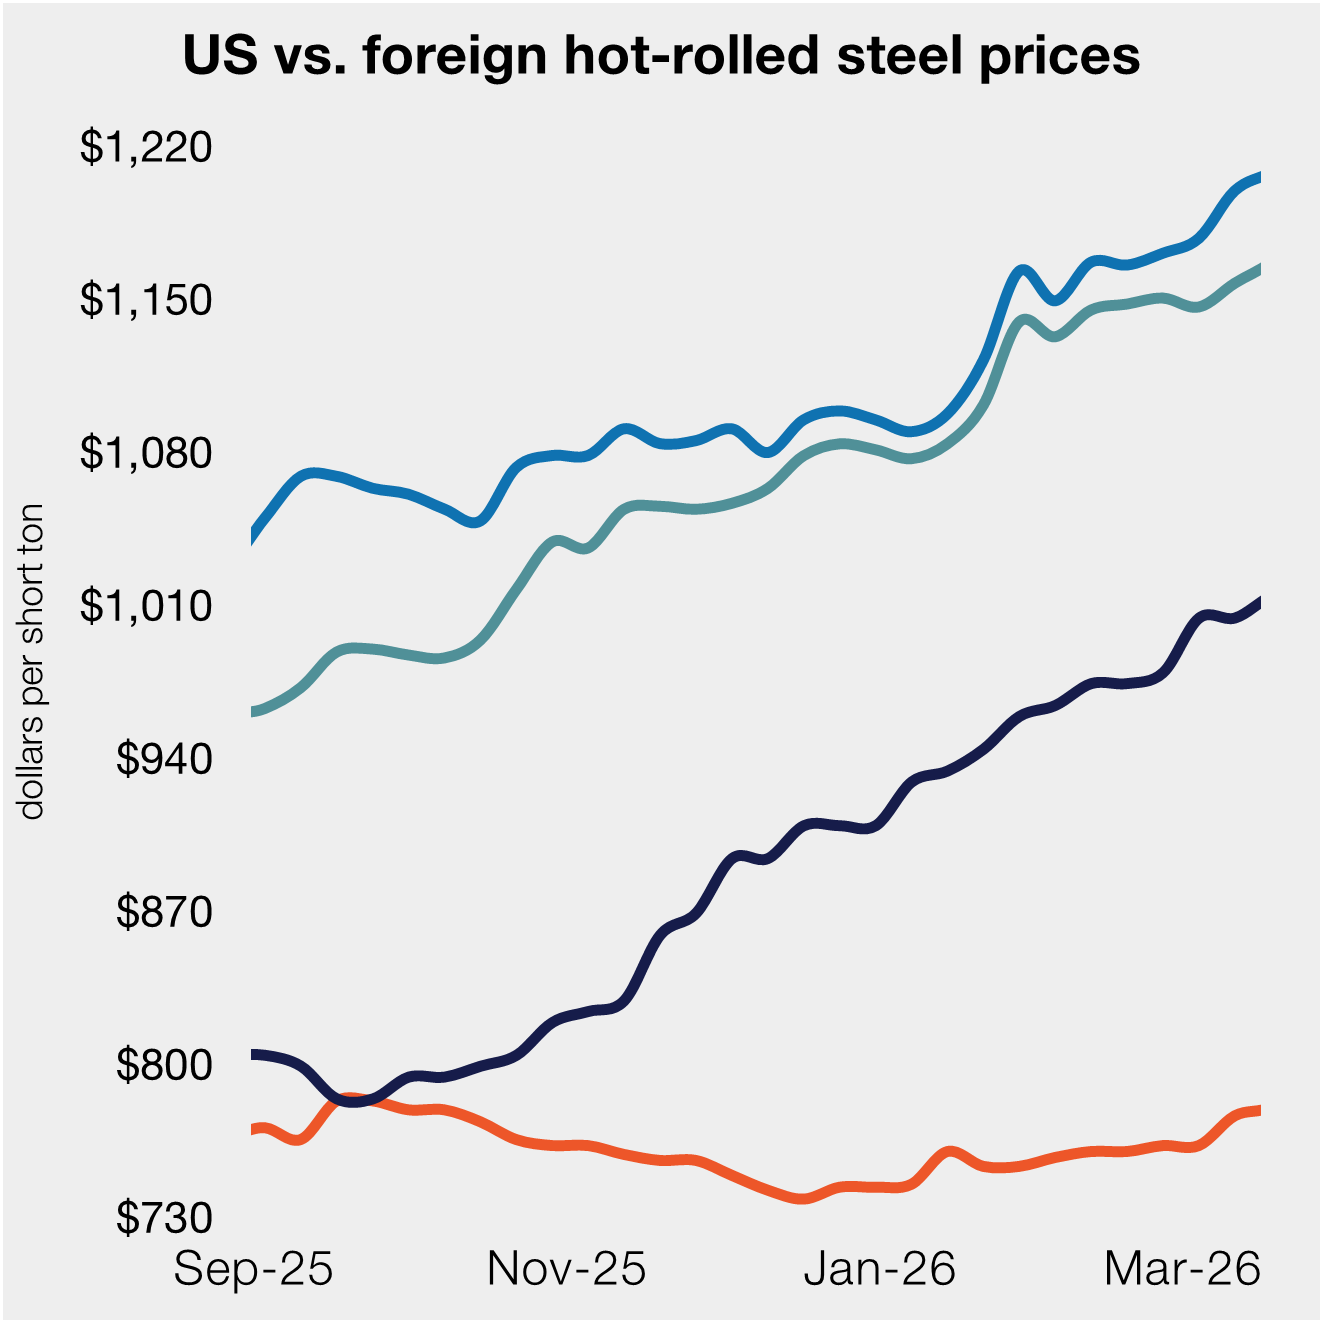
Scrap export prices are reported by the AMM every Tuesday for an 80:20 mix of #1 and #2 heavy melt in US $ per tonne FOB New York and Los Angeles for bulk tonnage sales. On January 1st the price on the East Coast was down by $131.47/gross ton in 12 months to reach $168 and by $98 on the West Coast to reach $179.5. Since then the East Coast price has held steady (down $1.00) and the West Coast price has declined by $7.50. We still believe that based on our benchmark comparisons between the price of scrap and the prices of iron ore and oil we see no upward potential for the domestic scrap price.