Market Data

February 16, 2015
Currency Update for Steel Trading Nations
Written by Peter Wright
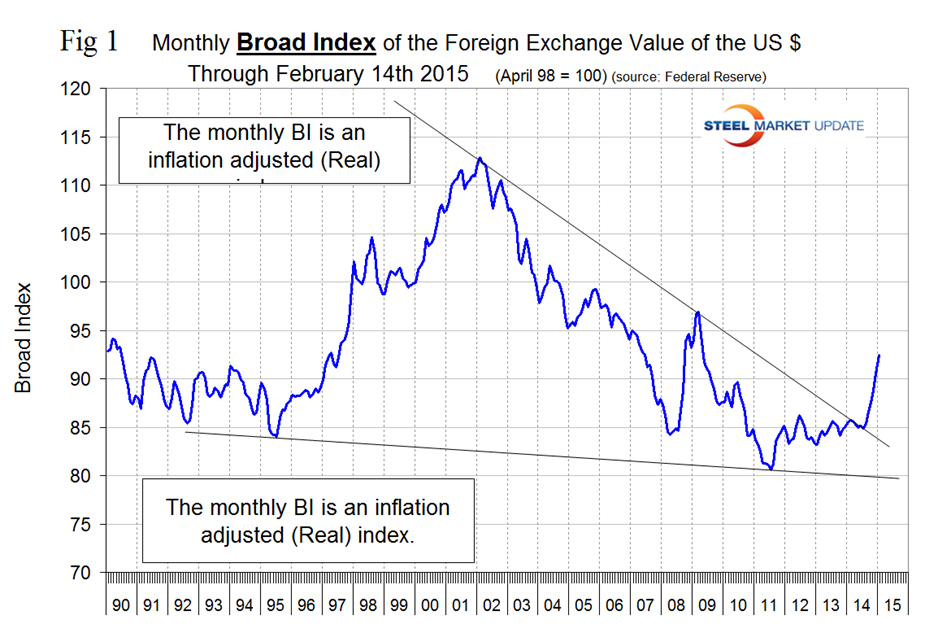
The monthly value of the Federal Reserve Broad Index value of the US $ against our major trading partners has continued to strengthen and in January reached 92.44 after breaking 90 in December for the first time since July 2009. The monthly BI is a “Real” inflation adjusted index. The Fed also reports a daily nominal (non-inflation adjusted) index.
![]() On February 3rd 2014, the value for the daily index was 103.8026, the index then weakened, turned around at mid-year and on February 6th (the last date published by the Fed) had reached 114.241 the highest value since March 12th 2009 and an increase of 10.9 percent in one year. Figure 1 shows real monthly index and that in the short term (4 years) the value of the US $ underwent steady appreciation for the first 3.5 years and has shot up strongly in the last six months.
On February 3rd 2014, the value for the daily index was 103.8026, the index then weakened, turned around at mid-year and on February 6th (the last date published by the Fed) had reached 114.241 the highest value since March 12th 2009 and an increase of 10.9 percent in one year. Figure 1 shows real monthly index and that in the short term (4 years) the value of the US $ underwent steady appreciation for the first 3.5 years and has shot up strongly in the last six months.
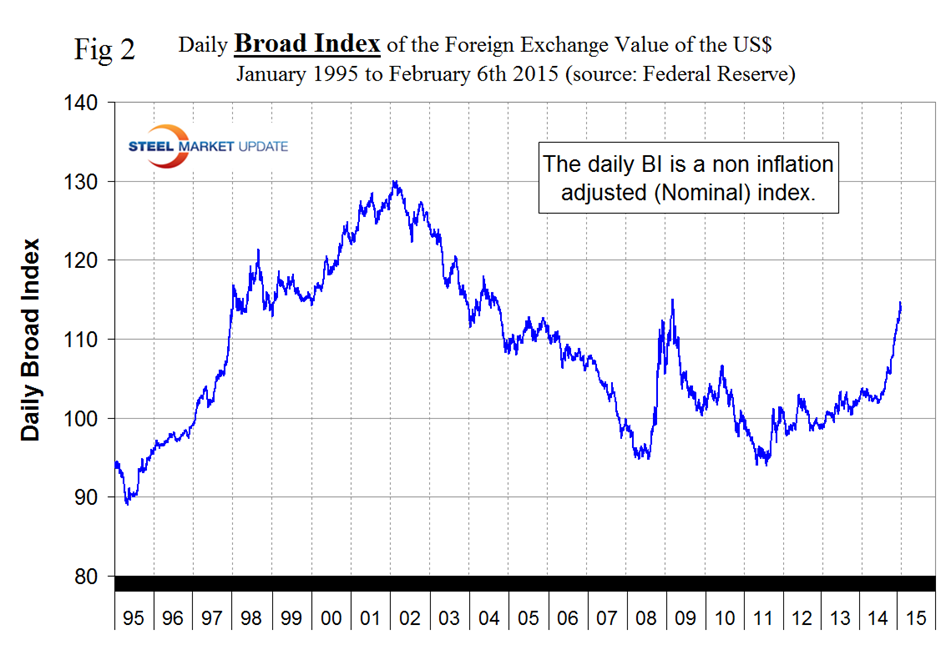
Figure 2 shows the nominal daily index through February 6th. The dollar weakened by 0.8 percent in the first days of February but is up by 6.1 percent in three months and 1.8 percent in one month.
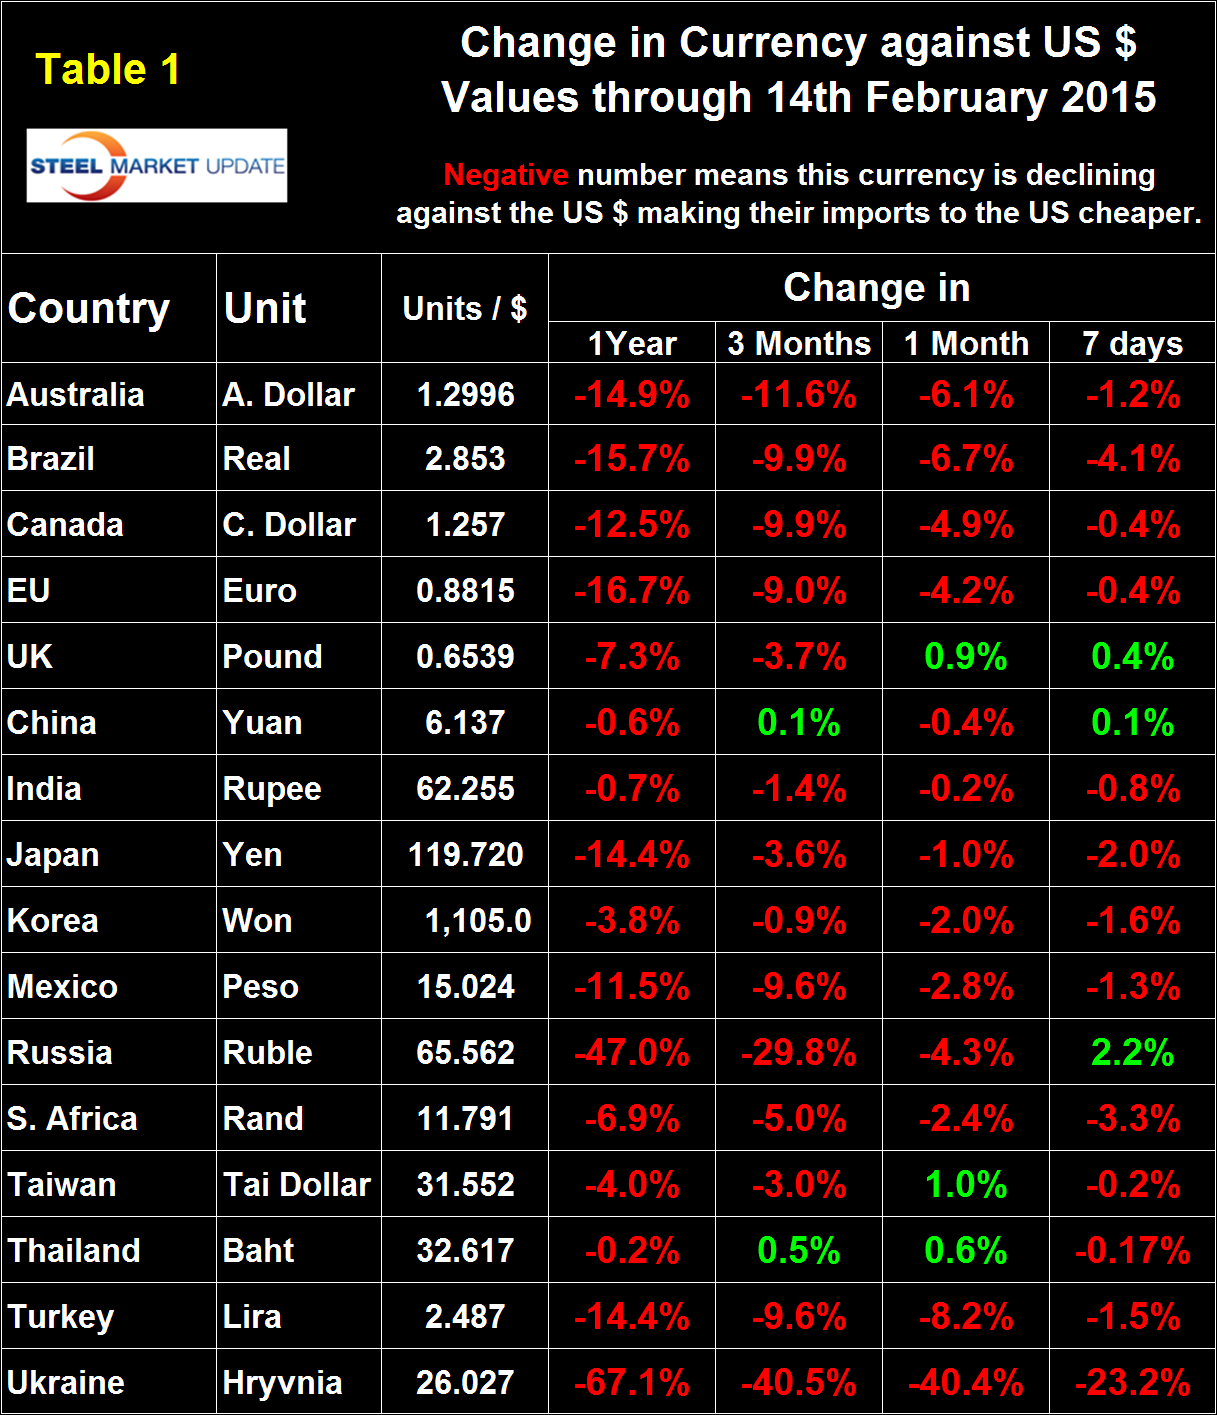
It does not necessarily follow that the currencies of the steel trading nations follow the Broad Index and in fact in the last seven days the dollar has continued to strengthen against 13 of 16 currencies of the major steel trading nations that we analyze at SMU. Table 1 shows the number of currency units of steel trading nations that it takes to buy one US dollar and the change in one year, three months, one month and seven days. Negative values for change indicate that the dollar is strengthening against a particular currency. An explanation of the source data is given at the end of this piece. In the last twelve months the dollar has strengthened against all 16 steel trading currencies and in the last three months has strengthened against 14 of them. In the last month the dollar has strengthened against 13. Table 1 is color coded to indicate strengthening of the dollar in red and weakening in green. We regard strengthening of the US Dollar as negative and weakening as positive because the effect on net imports.
On February 13th Rupert Nicholson was published in Seeking Alpha and made the following comments: After January’s payrolls data beat estimates, analysts expect the Federal Reserve to tighten US monetary policy, through raising interest rates in 2015. In contrast to this, the European Central Banks and other central banks have eased monetary policy through economic stimuli off the back of slowing global growth. In January, the ECB had launched a $1 trillion bond-buying program in an attempt to stimulate a weak Eurozone economy. A little earlier, in November 2014, the Bank of Japan also initiated a large scale quantitative easing regimen. As long-term bond yields become increasingly more attractive in the US relative to their peers, there will continue to be high demand for the US dollar driving appreciation in the currency. For example, in Germany the 10-year bond yield is just 0.37 percent while Japan’s yield is just 0.36 percent. A comparable US treasury yields 1.97 percent. Expect the bull- run in the value of the US $ to continue. With the possibility of a Greek exit from the Eurozone looming large, the dollar is still perceived as the safe currency during uncertain economic times. As the US economy heads into 2015, it seems set for strong relative growth compared to other developed economies which will fuel the dollar run-up.
On February 6th Comstock Partners wrote: We have been sounding the alarm about the deflationary process that is playing out in the world’s equity, bond and currency markets for quite some time. Because of the activity by central banks in major and more recently in developing countries we have described what is going on as “The Central Bank Bubble”. We strongly believe that the Currency Wars, (described in our Cycle of Deflation as “competitive devaluation”) have begun. Many countries have now joined “the race to the bottom”. Since the beginning of 2015 no fewer than 8 countries have unexpectedly cut interest rates in an effort to stimulate their economies. In our view, they clearly took these actions in a desperate attempt to export the deflationary forces that are plaguing them. For its part, Switzerland would have no part of defending the value of the Euro versus the Franc and decided to get “out of the way” and remove the cap that had existed since 2011. The reaction in the Swiss export dependent equity market was an immediate 15 percent correction. Imagine for a moment what the Swiss must expect to happen to the Euro once the ECB starts their “Quantitative Easing” program of about $1 tn. in March. They had to be frightened about the Euro declining sharply to be willing to take a valuation loss of that magnitude to their equity market in one day!
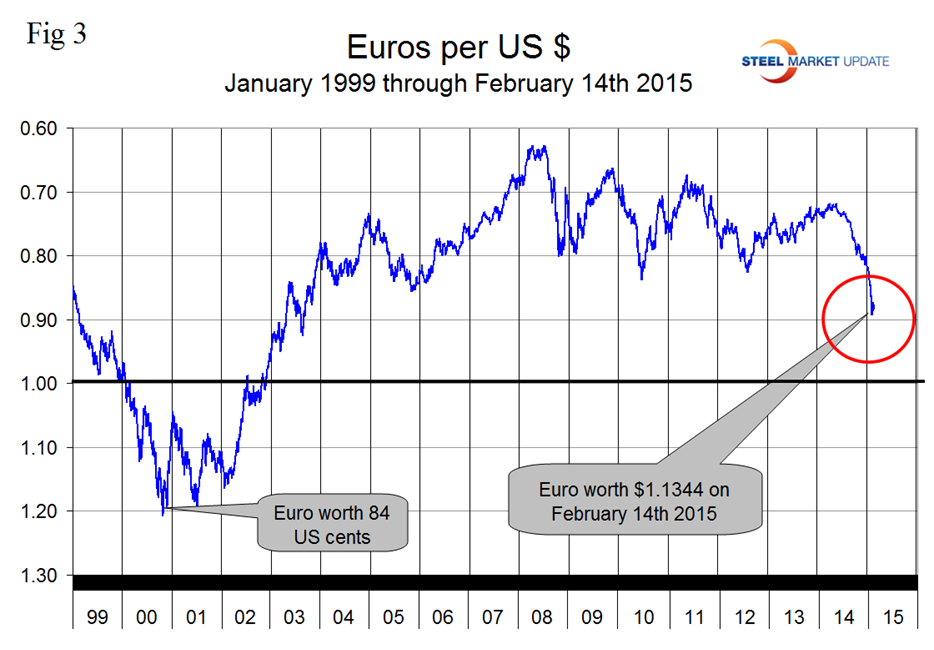
On September 6th the Euro broke through the 1.3 US $ / Euro level for the first time since July 11th last year and by January 15th had depreciated to a value of 1.1210 US dollars, its lowest value since May 1st 2003. In the last two weeks the Euro has recovered to 1.1344, (Figure 3). A devalued Euro means that US exports will be more expensive in Europe and European imports will be cheaper here. This is particularly true for steel trade. In addition European scrap will be more attractive to Turkish buyers than supplies from the US which will put downward pressure on domestic scrap prices.
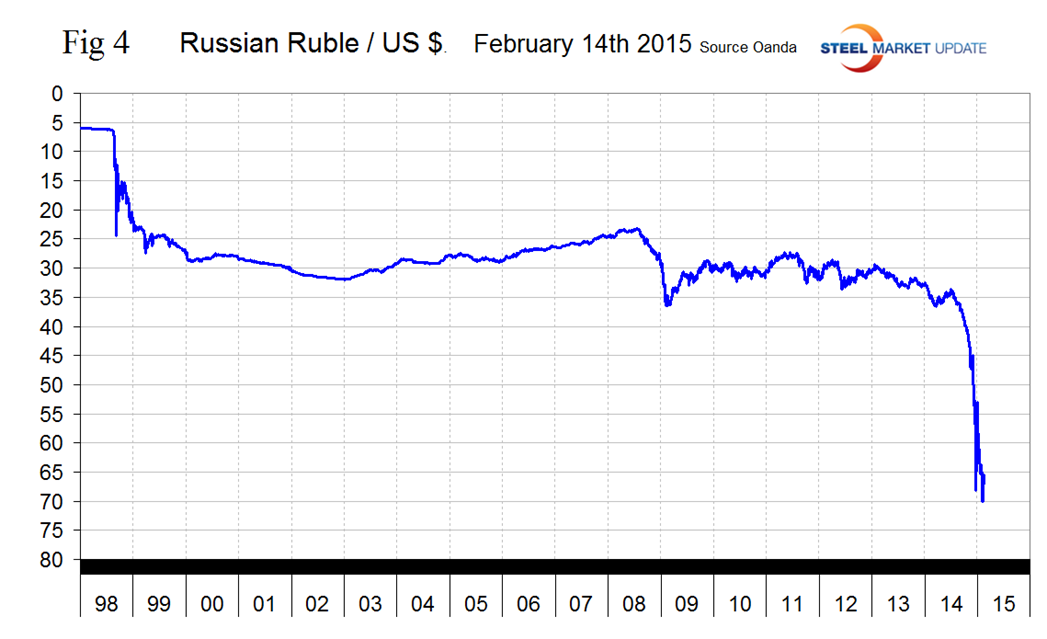
Except for Ukraine, the Russian Ruble has had the largest decline of all the steel trading nations in the last twelve and three month periods and on February 1st broke through 70 Rubles to the US Dollar, since then it has recovered to 65.56, (Figure 4).
The Russian Government could introduce Steel Export Duties if steelmakers do not reach a compromise with domestic end-users on price increases, according to Platts SBB. Russia’s Federal Antimonopoly Service (FAS) said that FAS will be consulted should an initiative to introduce a duty on steel gets go-ahead, but the agency has not received a formal note. Initially, the idea of customs duties and quotas on steel exports came from the letter the national association of railway wagon manufacturers sent to FAS to request the investigation of price increases of 20 percent announced by the mills for flat rolled products in the beginning of 2015. Even if export duties are not introduced, Russian steelmakers will be more cautious with export deliveries this year to avoid creating a deficit in the domestic market even though self-rationing of exports will not allow them to fully capitalize on the positive effect of falling cash costs from the RUB devaluation and cost-cutting initiatives, which have made them very competitive in the international markets.
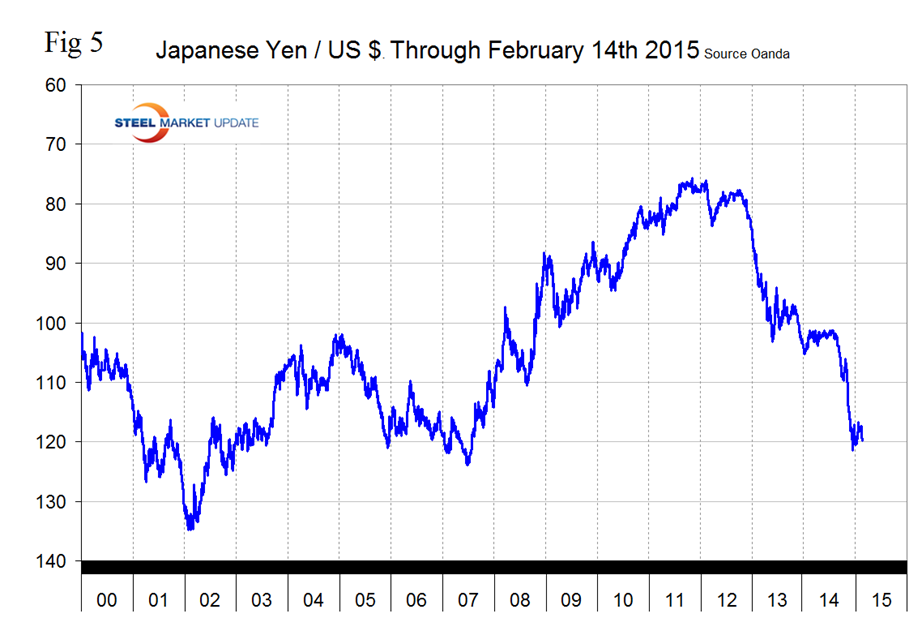
The Japanese Yen broke through the 120 level on December 6th before rallying slightly and has been flirting with that level ever since closing at 119.72 on February 14th, (Figure 5). It looks as though central bank intervention has had some success in breaking the Yen’s fall. Depreciation against the dollar has been 14.4 percent in 12 months, 3.6 percent in 3 months and 1.0 the last thirty days.
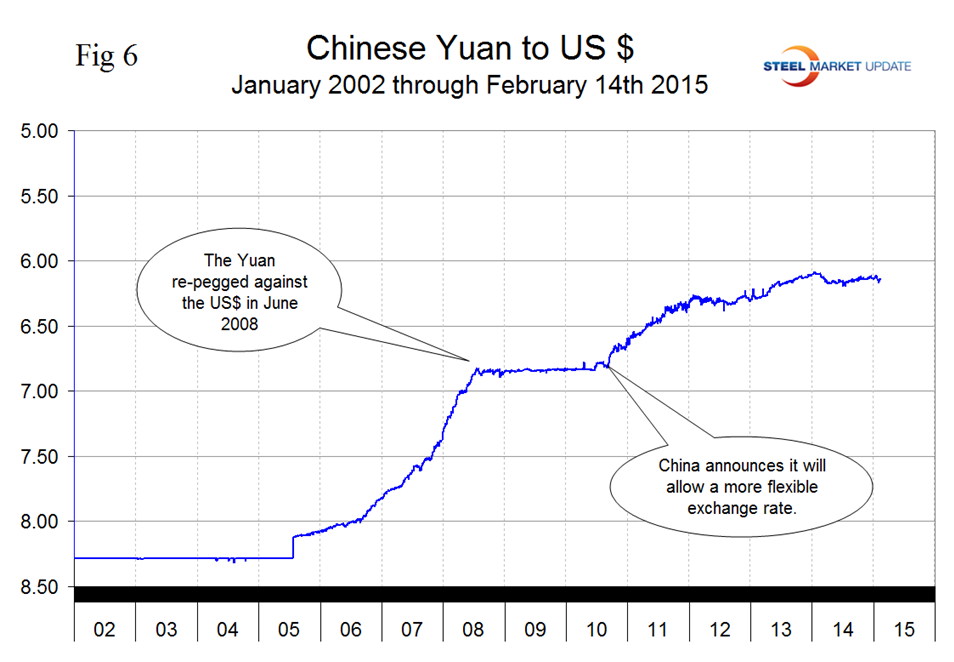
The Chinese Yuan closed at 6.1368 on February 14th with very little change in the last year, (Figure 6).
On February 13th Charles Hugh Smith asked, what is China’s currency the Yuan really worth? Nobody knows, because price discovery has been thwarted by the peg to the U.S. dollar. A pegged currency rises and falls against other currencies along with the underlying currency. As the dollar weakened from 2010 to mid-2014, China’s RMB weakened along with it. This allowed Chinese authorities to lower the peg without affecting the competitive value of the Yuan. Now that the USD has gained 16 percent in less than a year, that rise is dragging the Yuan higher with it, making China’s goods less competitive in markets outside the U.S. (and countries which use the USD as their currency). This major move has prompted Chinese authorities to widen the peg’s range to allow the Yuan to weaken slightly against the dollar. Japan’s stunning devaluation of the Yen has prompted much speculation that China will be forced to either end the peg to the USD or loosen the peg to match the depreciation of the Yen. If China does end the peg, many factors will go into pricing the Yuan on the global market. Currencies generally act like other commodities: their value is set by supply and demand. If there is strong demand for Yuan and limited supply on the FX market, the value will rise. If there is low demand and abundant supply, the value will decline against other currencies. I suspect China’s leadership is wary of unpegging the Yuan because they are accustomed to controlling key elements of the Chinese economy, and the idea that the global market would determine the critical value of the Yuan rather than the Chinese leadership must be sobering.”
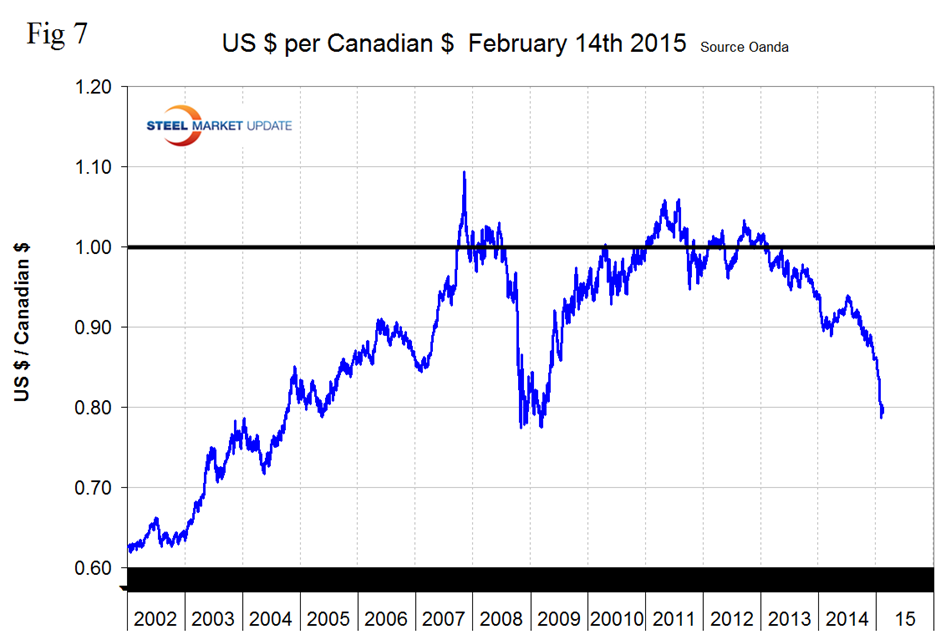
After trading in the mid to low 90 cent region for most of last year the Canadian dollar has crashed through 80 cents and stood at 79.55 cents on February 14th. The decline has been accelerating since the middle of last year. The Canadian $ has declined by 12.5 percent in the last twelve months, 9.9 percent in three months, 4.9 percent in one month and 0.4 percent in seven days, (Figure 7).
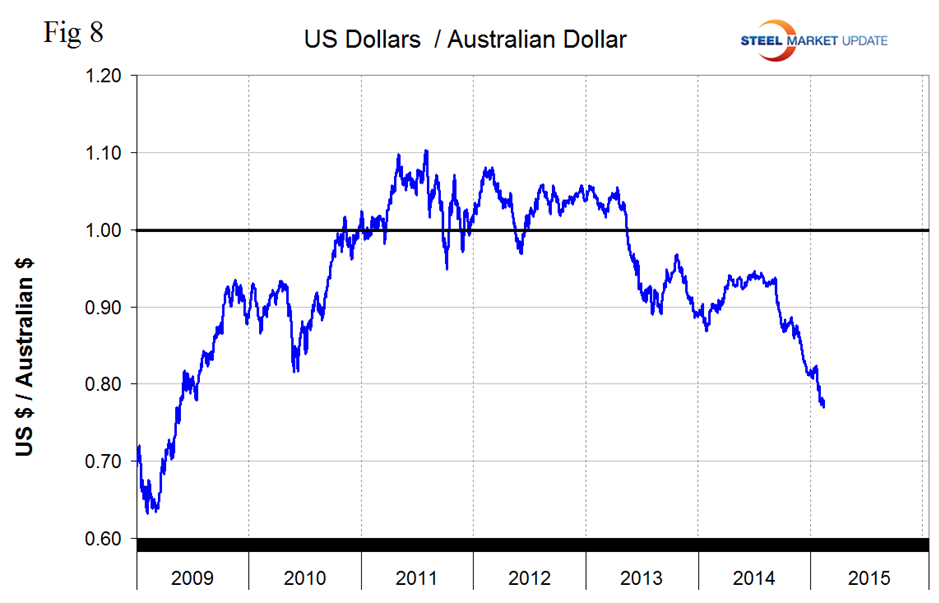
The reversal of the ‘carry-trade’ (borrow US$, buy something else higher yielding) has been well underway since the Fed announced last year that it would end QE3. Emerging country currencies have plummeted, together with commodity prices. Australian and Canadian commodity producers that borrowed heavily in USD have been doubly hit by a stronger US$ and plunging commodity prices, including iron ore, and their share prices have plummeted. The Australian $ broke through 80 cents on January 24th and now stands at 76.95 cents, down by 6.1 percent in the last month, (Figure 8).
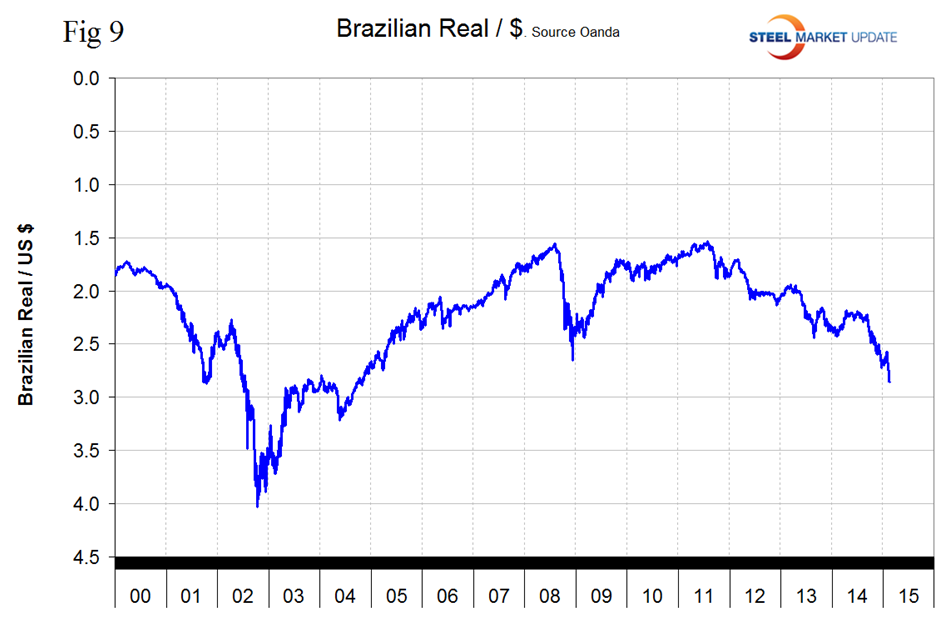
The Brazilian Real rallied in early January but is now once again declining rapidly, closing at 2.853 on February 14th, (Figure 9).
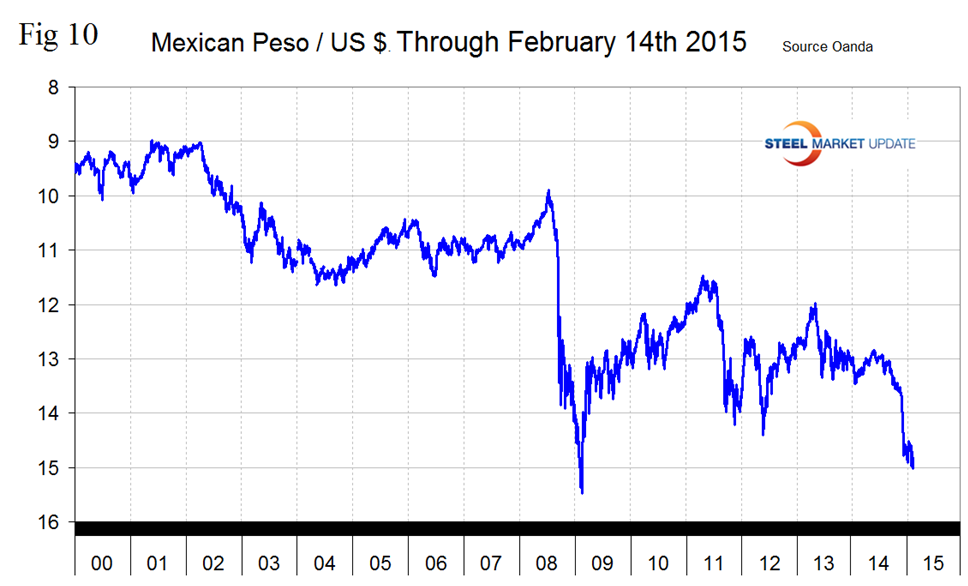
The Mexican Peso broke through 15 to the US Dollar this last Thursday and closed at 15.0235 on the 14th. Down by 9.56 percent in 3 months, 2.8 percent in one month, and 1.3 percent in seven days, (Figure 10). The Peso is weaker than at any time since early 2009 which has severe implications for the distribution of manufacturing within NAFTA.
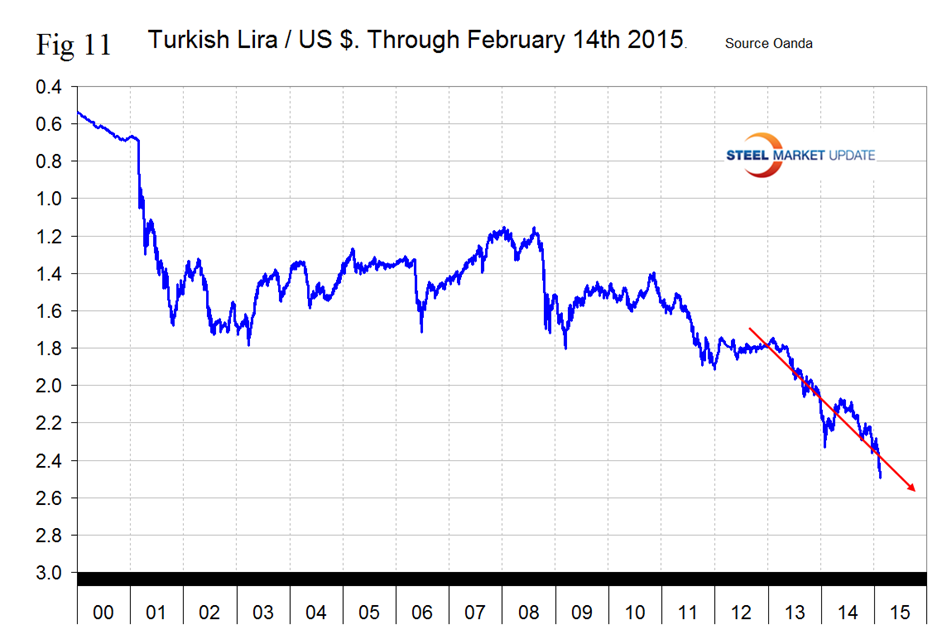
The Turkish Lira broke through 2.4 to the dollar on January 30th and has since declined to 2.4872 its all-time low. The Lira has declined by 14.4 percent in the last year and by 1.5 percent in the last week, (Figure 11).
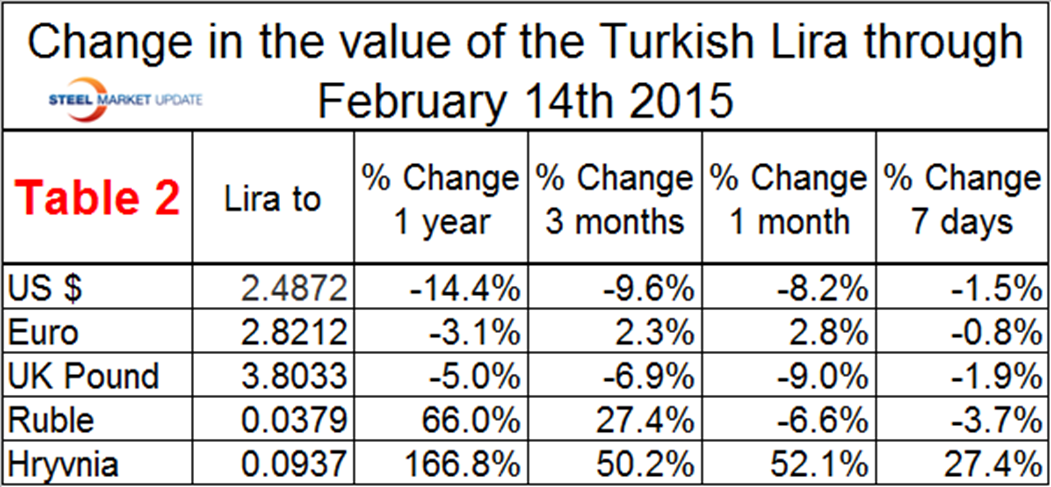
This causing Turkey to look for alternatives to the US for its scrap supply. Table 2 shows how the value of the Turkish Lira has changed against its major scrap and or semi-finished suppliers. The US position as a scrap supplier has deteriorated strongly as the Dollar has strengthened against the Lira by more than is the case for the Euro or the British Pound. In the last three months the Lira has strengthened by 27.4 percent against the Russian Ruble making purchases in Russia that much more attractive. The change against the Ukrainian Hryvnia is probably irrelevant given the situation in that country.
SMU Comment: This is an extraordinary time in the world’s currency markets. We are ominously reminded of 1997. Trends are not good for US steel producer competitiveness and will continue to drive net imports higher and raw materials prices lower. In this monthly analysis we report on the currencies that we think have the most immediate significance, but all 16 steel trading nation graphs are available on request if any reader has a special interest that we haven’t covered.
Explanation of Data Sources: The broad index is published by the Federal Reserve on both a daily and monthly basis. It is a weighted average of the foreign exchange values of the U.S. dollar against the currencies of a large group of major U.S. trading partners. The index weights, which change over time, are derived from U.S. export shares and from U.S. and foreign import shares. The data are noon buying rates in New York for cable transfers payable in the listed currencies. At SMU we use the historical exchange rates published in the Oanda Forex trading platform to track the currency value of the US $ against that of sixteen steel trading nations. Oanda operates within the guidelines of six major regulatory authorities around the world and provides access to over 70 currency pairs. Approximately $4 trillion US $ are traded every day on foreign exchange markets.


