Market Data

January 28, 2015
Currency Update for Steel Trading Nations
Written by Peter Wright
Turmoil continues in the global currency markets as the European Central Bank announced a quantitative easing program last week, S&P downgraded Russian debt to junk status yesterday, the Greek national election on Sunday will result in a strong resistance to EU mandated austerity programs and the Swiss removed the currency cap vs the Euro last week.
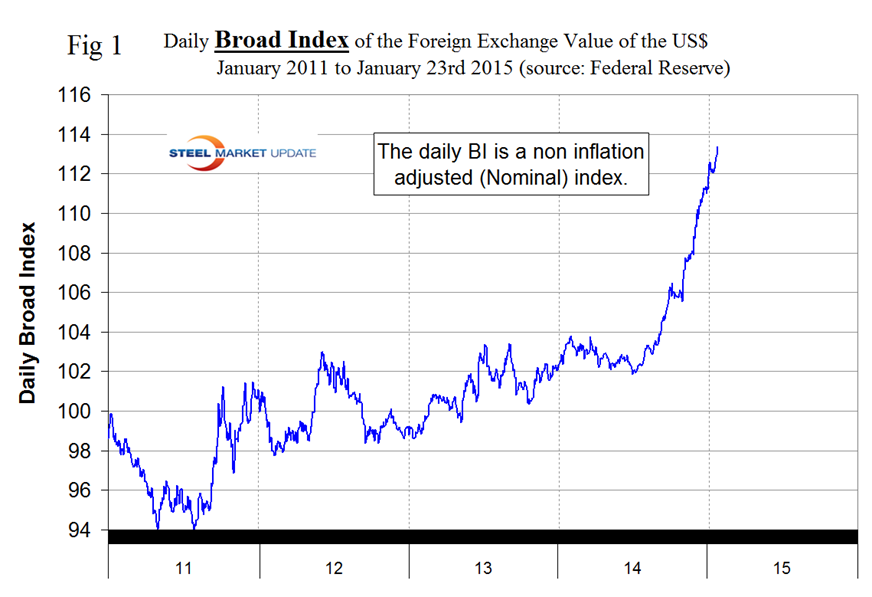
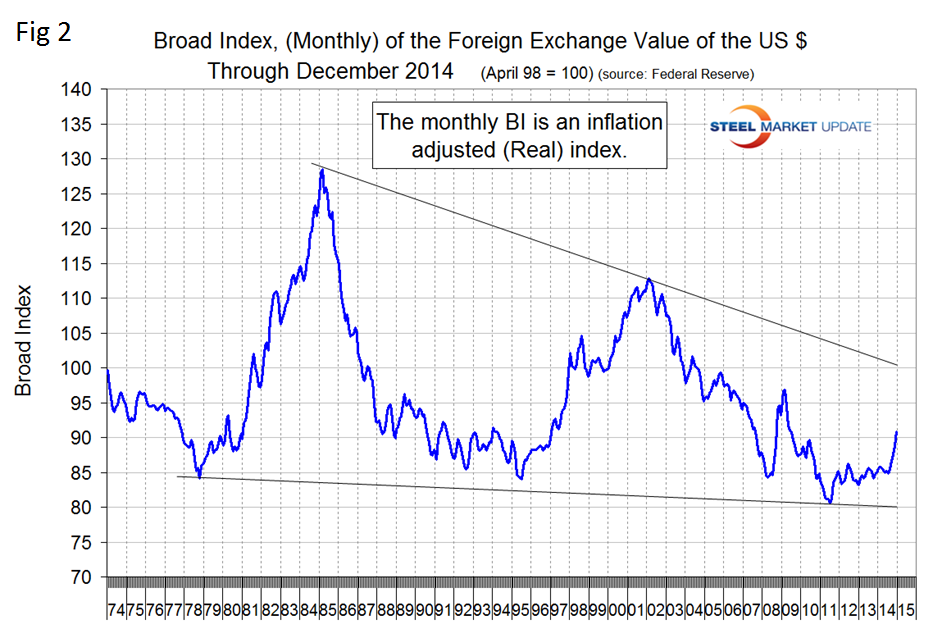
![]() The monthly value of the Federal Reserve Broad Index value of the US$ against our major trading partners has continued to strengthen and in December passed 90 for the first time since July 2009. The monthly BI is a “Real” inflation adjusted index. The Fed also reports a daily nominal, (non-inflation adjusted) index. On February 3rd 2014, the value for the daily index was 103.8026, the index then weakened, turned around at mid-year and on January 23rd (the last date published by the Fed) had reached 113.374 the highest value since March 12th 2009. As an example of how data can be “Spun” it is interesting to compare the long term and short term history of the US dollar’s strength. Figure 1 shows that in the short term, (4 years) the value of the US$ underwent steady appreciation for the first 3.5 years and has shot up strongly in the last six months.
The monthly value of the Federal Reserve Broad Index value of the US$ against our major trading partners has continued to strengthen and in December passed 90 for the first time since July 2009. The monthly BI is a “Real” inflation adjusted index. The Fed also reports a daily nominal, (non-inflation adjusted) index. On February 3rd 2014, the value for the daily index was 103.8026, the index then weakened, turned around at mid-year and on January 23rd (the last date published by the Fed) had reached 113.374 the highest value since March 12th 2009. As an example of how data can be “Spun” it is interesting to compare the long term and short term history of the US dollar’s strength. Figure 1 shows that in the short term, (4 years) the value of the US$ underwent steady appreciation for the first 3.5 years and has shot up strongly in the last six months.
Figure 2 shows the situation since 1974 and illustrates that the dollar is nowhere near its two previous peaks of 1985 and 2002. We don’t intend to minimize the present situation, rather to show that it likely has a long way to run.
The daily Broad Index has strengthened by 9.7 percent in 12 months, 5.8 percent in the last three months, 1.9 percent in the last month and 1.0 percent in the last seven days.
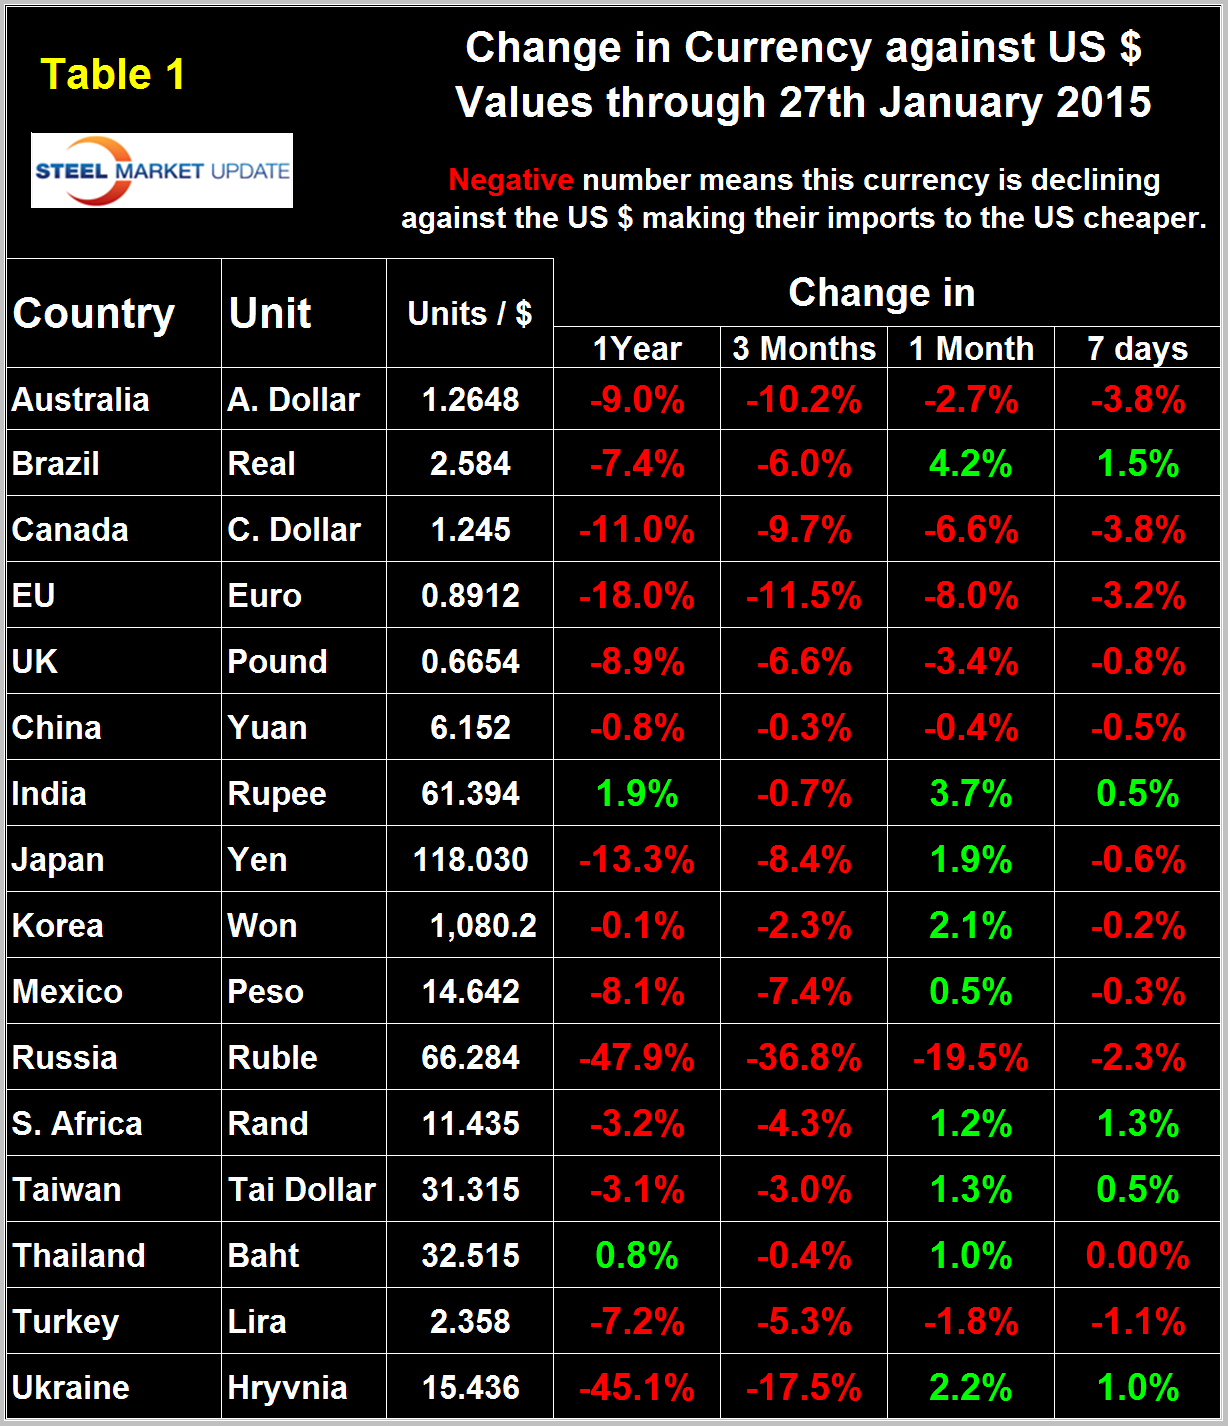
It does not necessarily follow that the currencies of the steel trading nations follow the Broad Index and in fact in the last month the dollar has taken a breather against nine of the sixteen steel trading currencies that we analyze at SMU. Table 1 shows the number of currency units of steel trading nations that it takes to buy one US dollar and the change in one year, three months, one month and seven days. Negative values for change indicate that the dollar is strengthening against a particular currency. An explanation of the source data is given at the end of this piece. In the last twelve months the dollar has strengthened against 14 of the 16 steel trading currencies and in the last three months has strengthened against all of them. However in the last month the dollar has weakened against nine, of which four reversed in the last seven days. Table 1 is color coded to indicate strengthening of the dollar in red and weakening in green. We regard strengthening of the US Dollar as negative and weakening as positive because the effect on net imports.
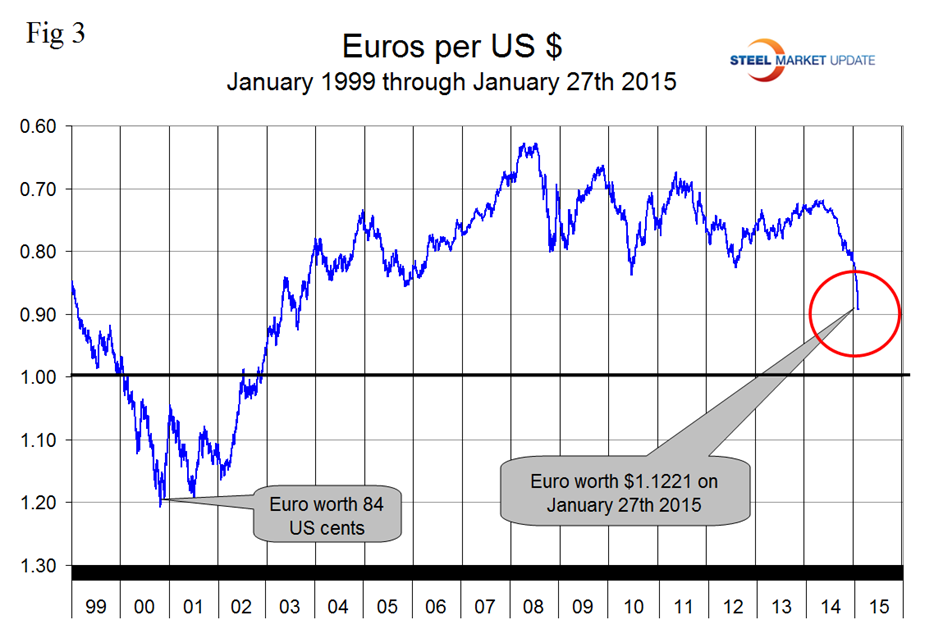
The Euro has been grabbing most of the currency related headlines in the last week. On September 6th the Euro broke through the 1.3 US$/Euro level for the first time since July 11th last year and by January 27th had depreciated to a value of 1.1221 US dollars, its lowest value since May 1st 2003, (Figure 3).
A devalued Euro means that US exports will be more expensive in Europe and European imports will be cheaper here. This is particularly true for steel trade. In addition European scrap will be more attractive to Turkish buyers than supplies from the US which will put downward pressure on domestic scrap prices.
To combat the economic issues in both Greece and the currency bloc as a whole, the European Central Bank enacted an asset-purchases program in January. The ECB aims to purchase public and private sector assets worth € 60 billion per month starting March 2015 until September of 2016. This will add up to €1.14 trillion by the end of September 2016 with the intent to achieve their 2 percent inflation goal in the medium term. However, the September 2016 date is not a fixed deadline, as the ECB qualified that they retain the right to keep conducting this monetary accommodation program until they see inflation.
The QE program, similar to the one Fed undertook from 2008 to 2014 is expected to reduce borrowing cost, increase spending and boost growth, according to Trading Economics. As the ECB embarks on further stimulus measures, alongside a deflationary spiral in the euro area as a whole, bond yields in the more stable euro area countries continue to decline. Germany’s 10-year government bond yield declined from near 5 percent in 2007, to now 0.32 percent.
With the Syriza party being elected in Greece, putting into jeopardy current bailout conditions, alongside weaker economic conditions in the euro area as a whole, it looks as if low interest rates will remain the norm in the currency bloc. This should weigh on the price of the euro in coming months, while the magnitude of declines in the euro could grow significantly if Greece attempts to leave the currency bloc under Tsipras reign. The populist proposals made by Syriza will not fix any of the underlying structural problems and will likely make them even worse. There is simply not the money to do what they have promised. Undoing the economic and labor reforms that have been achieved under the austerity program will put any future growth even further out of reach. If no agreement is reached (and the deadline is approaching), Greece will face a cash crunch within months. The spectacle of a high-income economy running out of money has not been seen since the 1930s. The only way to cover the shortfall would be for Greece to quit the Eurozone and start printing its own currency again.
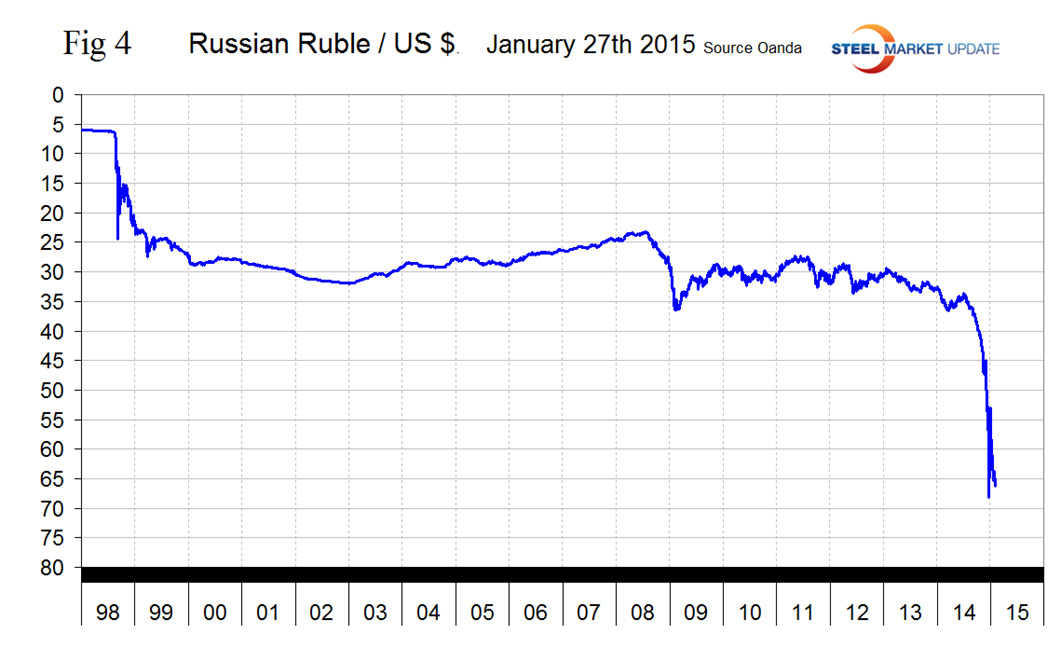
The Russian Ruble has had the largest decline of all the steel trading nations in the last three months and is in virtual free fall, (Figure 4).
Multiple interest rate increases resulted in a 10 day strengthening period at the end of 2014 but in the first 27 days of this year the decline re-emerged. The decline accelerated when S&P downgraded Russian bonds to junk status on the 26th. Reuters reported as follows on January 27th. The Ruble fell 6 percent on Monday, with around half the loss following S&P’s downgrade in the evening. Russian assets had already fallen sharply before the decision because of renewed fighting in Ukraine and the threat of fresh Western sanctions against Russia.
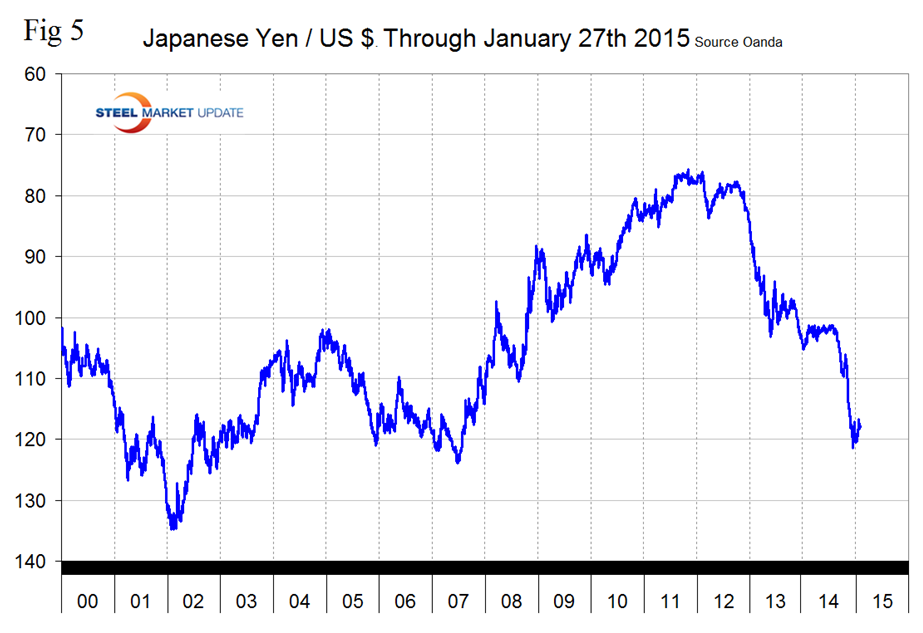
The Japanese Yen broke through the 120 level on December 6th before rallying slightly then settled in stronger than 120 for the last 21 days, (Figure 5).
It looks as though central bank intervention has stabilized the Yen for the moment and it actually strengthened by 1.9 percent against the $ in the last month. The Yen is down by 13.3 percent in 12 months and 8.4 percent in 3 months. Some analysts are predicting a level of 200 Yen/Dollar in the not too distant future. The IMF reported this week, “In Japan, the economy fell into technical recession in the third quarter of 2014. Private domestic demand did not accelerate as expected after the increase in the consumption tax rate in the previous quarter, despite a cushion from increased infrastructure spending. Policy responses—additional quantitative and qualitative monetary easing and the delay in the second consumption tax rate increase—are assumed to support a gradual rebound in activity and, together with the oil price boost and yen depreciation, are expected to strengthen growth to above trend in 2015–16.”
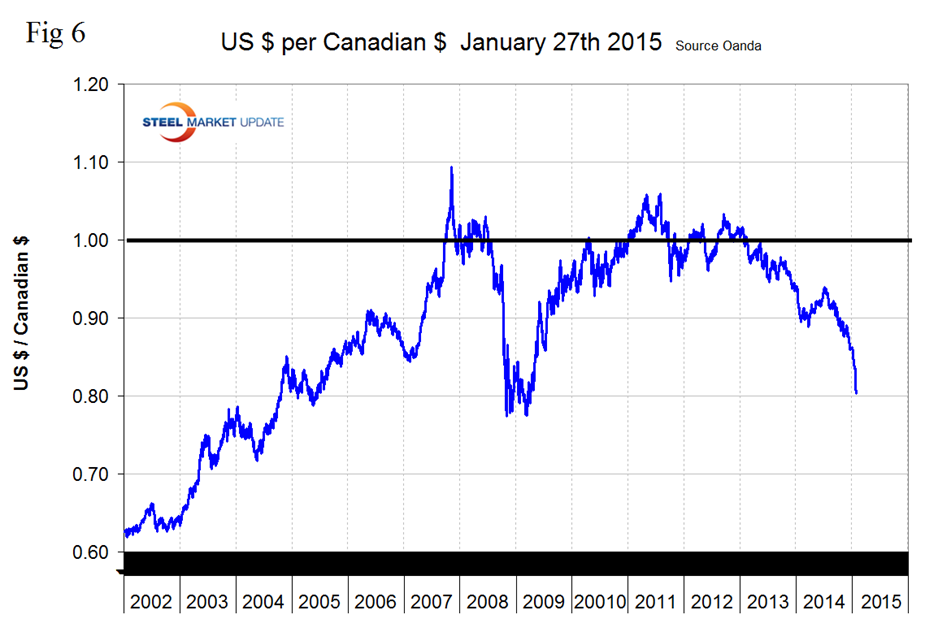
After flirting with the 90 US cent valuation early in 2014, the Canadian $ broke through that level on September 27th and is now rapidly heading for 80 cents, closing at 0.8035 on the 27th. The decline has been accelerating since mid-year. The Canadian $ has declined by 11.0 percent in the last year, 9.7 percent in three months, 6.6 percent in one month and 3.8 percent in seven days, (Figure 6).
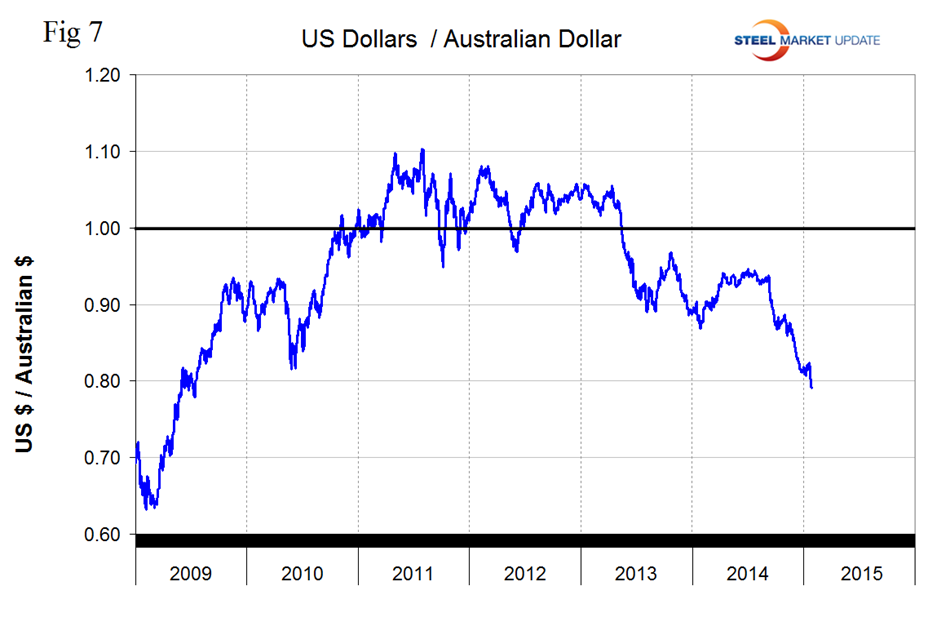
The reversal of the ‘carry-trade’ (borrow US$, buy something else higher yielding) has been well underway since the Fed announced last year that it would end QE3. Emerging country currencies have plummeted, together with commodity prices. Australian and Canadian commodity producers that borrowed heavily in USD have been doubly hit by a stronger US$ and plunging commodity prices, including iron ore, and their share prices have plummeted. The Australian $ broke through 80 cents on the 24th and is heading straight down, (Figure 7).
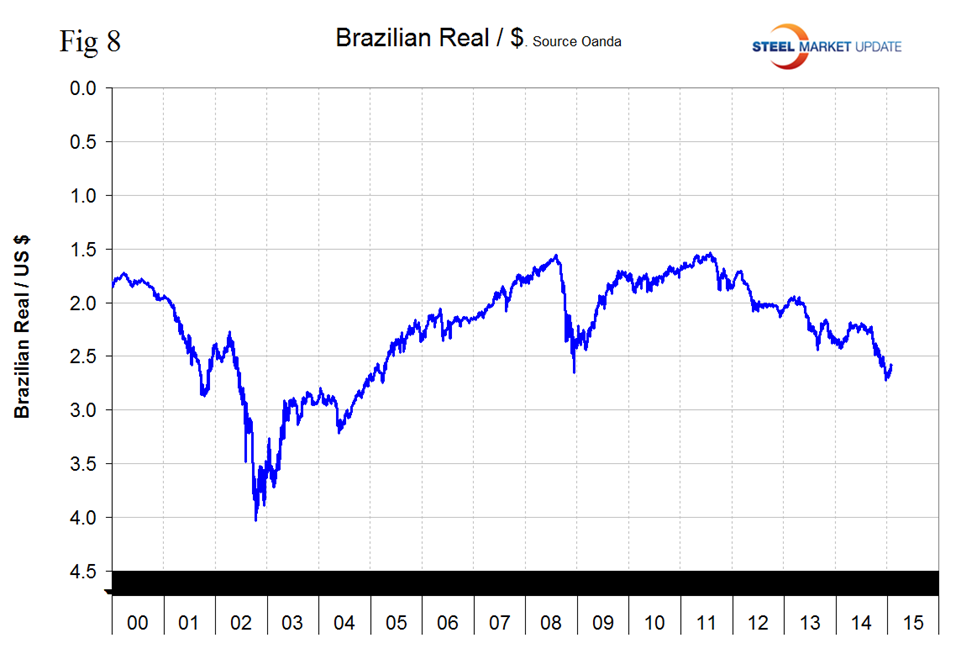
The Brazilian Real has recovered from its low point of 2.723 on December 18th to close at 2.584 on the 27th, (Figure 8).
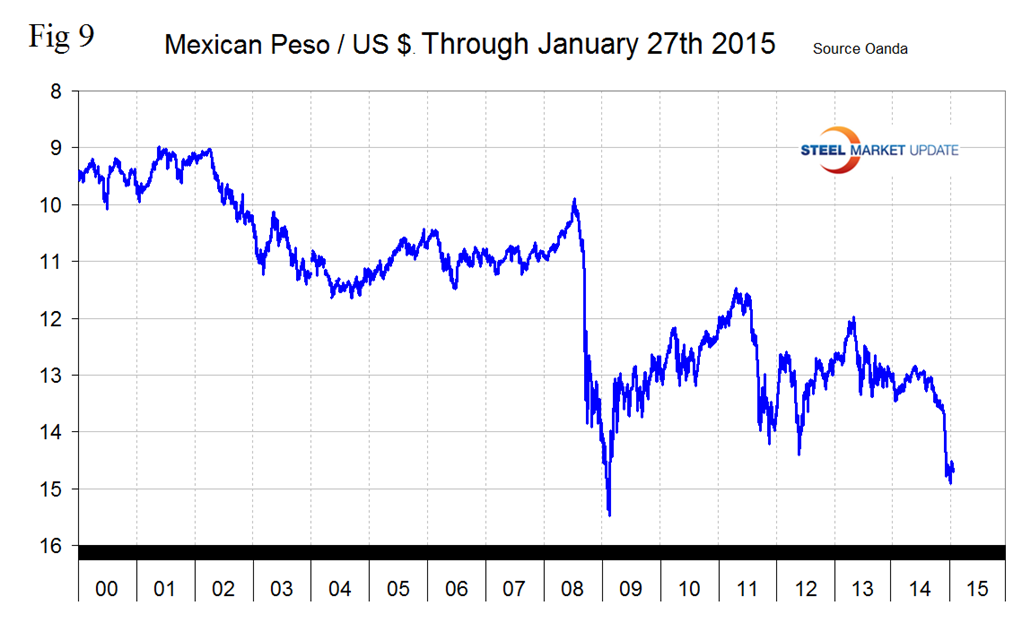
The Mexican Peso closed at 14.6423 on January 27th, down by 7.44 percent in three months but up by 0.5 percent in the last month, (Figure 9). The Peso is oscillating in a range weaker than at any time since early 2009.
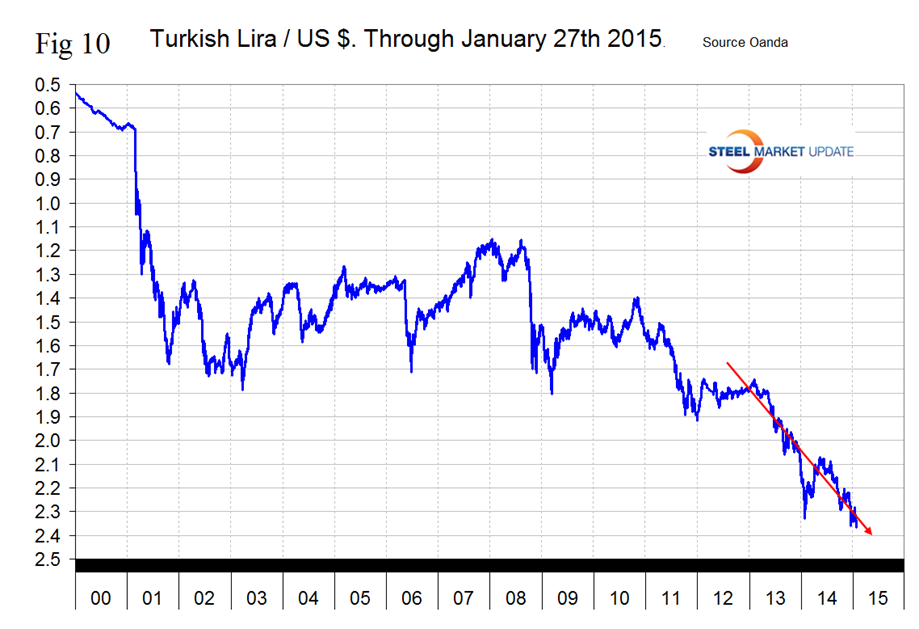
The Turkish Lira closed at 2.3578 to the $ on January 27th which was a slight recovery from its all-time low the day before. The Lira has declined by 7.2 percent in the last year and by 1.1 percent in the last week, (Figure 10).
SMU Comment: This is an extraordinary time in the world’s currency markets. We are ominously reminded of 1997. Trends are not good for US steel producer competitiveness and will continue to drive net imports higher and raw materials prices lower. In this monthly analysis we report on the currencies that we think have the most immediate significance, but all 16 steel trading nation graphs are available on request if any reader has a special interest that we haven’t covered.
Explanation of Data Sources: The broad index is published by the Federal Reserve on both a daily and monthly basis. It is a weighted average of the foreign exchange values of the U.S. dollar against the currencies of a large group of major U.S. trading partners. The index weights, which change over time, are derived from U.S. export shares and from U.S. and foreign import shares. The data are noon buying rates in New York for cable transfers payable in the listed currencies. At SMU we use the historical exchange rates published in the Oanda Forex trading platform to track the currency value of the US$ against that of sixteen steel trading nations. Oanda operates within the guidelines of six major regulatory authorities around the world and provides access to over 70 currency pairs. Approximately $4 trillion US$ are traded every day on foreign exchange markets.


