Market Data

January 4, 2015
December 2014 Steel Data at a Glance
Written by John Packard
The following is an overview of some of the key steel data collected by Steel Market Update during the month of December 2014. This is separate from our Key Market Indicators which was produced for our Premium level subscribers (although shared with all of our readers on Friday of this past week).
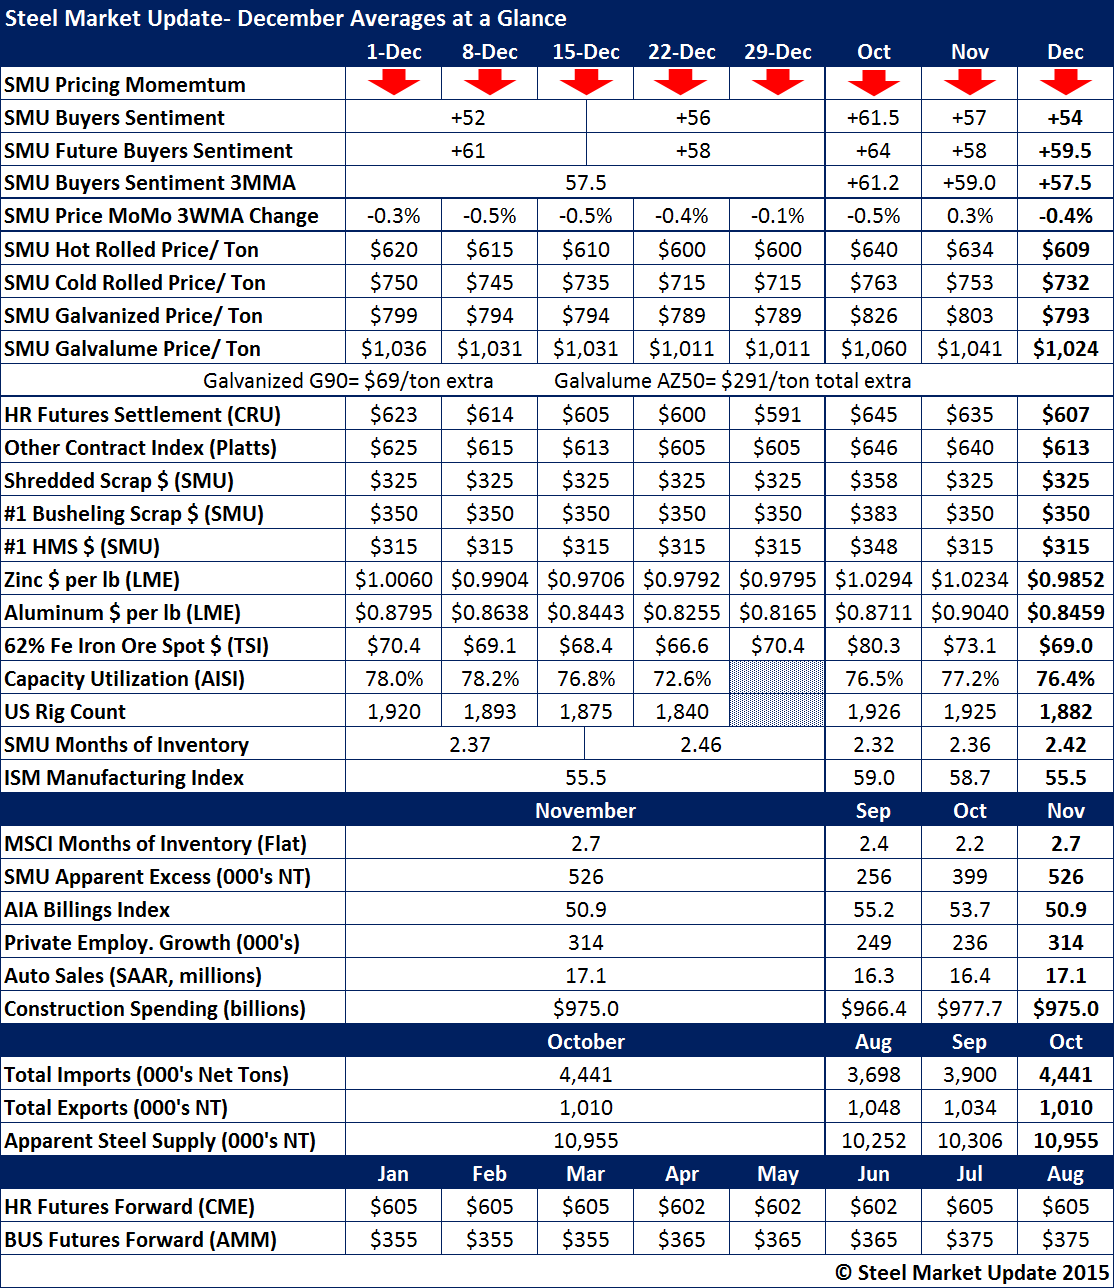
Steel Market Update kept our Price Momentum Indicator pointing toward lower prices during the entire month. We saw benchmark hot rolled prices slip from $630 per ton reported during the last week of November to $600 per ton by the third week of December. Steel Market Update maintained our $600 mark this past week (as did Platts at their $605 number), but it should be noted that CRU dropped to $591 per ton.
The three key indices (SMU, CRU and Platts) averages for the month were $609 (SMU), $607 (CRU) and $612.50 (Platts). The adjustments from the previous month averages were: $25 per ton (SMU), $28 per ton (CRU) and $27.50 (Platts).
SMU cold rolled averaged $732 per ton for the month (ending month at $715 per ton). Galvanized .060” G90 with its $69 per ton in extras averaged $793 per ton for the month (ending month at $789 per ton) while Galvalume .0142” AZ50, Grade 80 with its $291 per ton in extras averaged $1024 per ton (ending month at $1011 per ton).
As you can see in the table below, our SMU Steel Buyers Sentiment Index has been trending lower (current Sentiment) over the past three months after reaching a historical high during the month of October.
Zinc prices dropped below $1.00 per pound and aluminum dipped close to $0.80 per pound by the end of the month.
Iron ore spot prices for 62% Fe fines in China bounced back from the mid $60’s to right around $70 per dry metric ton by the end of the month.
Oil rig count averages dropped from 1,925 rigs to 1,882. This is something we will need to watch carefully due to the drop in worldwide oil prices.
Service center inventories are growing based on MSCI data (2.7 months), our own survey data (2.42 months) and our Premium product: Service Center Inventory Apparent Excess which rose to 526,000 tons.
Steel imports have been rising from August 3.7 million tons, September 3.9 million tons to October 4.441 million tons. December imports will be closer to 3.2 million tons once all the final data is compiled by the US Department of Commerce.
Hot rolled futures forward curve is fairly flat at $605 for most forward months (remember CRU is now at $591 so the market is in contango).