

Market Data

January 2, 2015
Key Market Indicators December 31st 2014
Written by Peter Wright
An explanation of the Key Indicators concept is given at the end of this piece for those readers who are unfamiliar with it.
The total number of indicators considered in this analysis is currently 36.
Please refer to Table 1 for the view of the present situation and the quantitative measure of trends. Readers should regard the color codes in the present situation column as a quick look at the current market condition. This is a subjective analysis based on our opinion of the level of each indicator. The “Trend” columns of Table 1, also by their color codes are designed to give a quick visual appreciation of the direction in which the market is headed. However the quantitative analysis of the value and direction of each indicator over time are the latest “facts” available. There is nothing subjective about this section which is designed for those readers who want to dig deeper. All data included in this table was released in December, the month or specific date to which the data refers is shown in the second column from the far right and all data is the latest available as of December 31st.
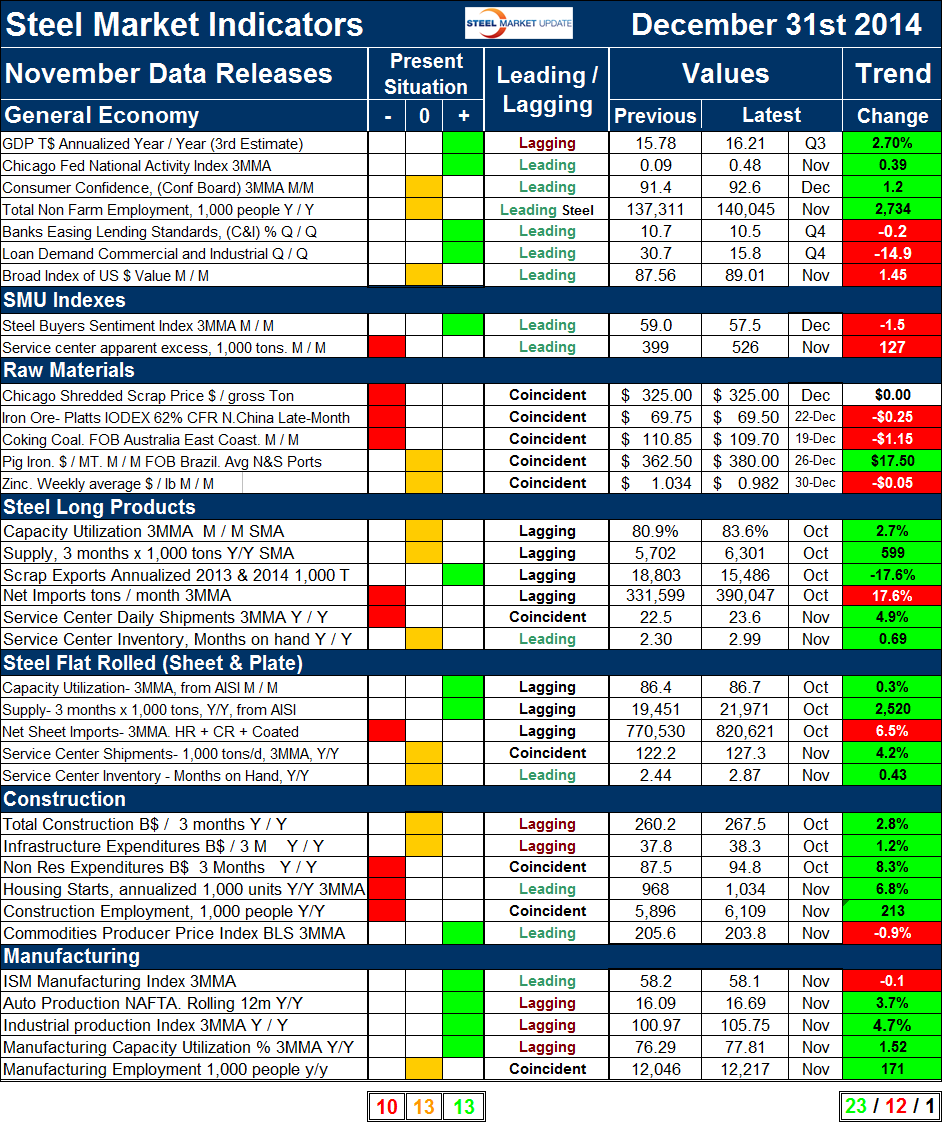
Present Situation: There has been a deterioration in the present situation since this analysis was last published on November 30th. Sixteen of the present situation indicators based on historical standards were positive on November 30th, ten were negative with ten considered to be close to the historical norm. By December 31st the number of indicators currently positive had declined by 3 to 13 and the number considered neutral had increased by 3 to 13. There was no change in the number of indicators considered to be negative by historical standards which remained at 10 of 36.
The three indicators that were changed from positive to neutral were as follows; the Kitco daily spot price of zinc fell below $1.00 per lb. on December 30th and closed at $ 0.982 per lb. We regard the $1.00 level as the break point between positive and neutral. Service center months on hand increased dramatically in November by more than the seasonal norm for both long products and flat rolled. Long products closed out November at 2.99 months and flat rolled at 2.87 months.
There were no other changes in the present situation.
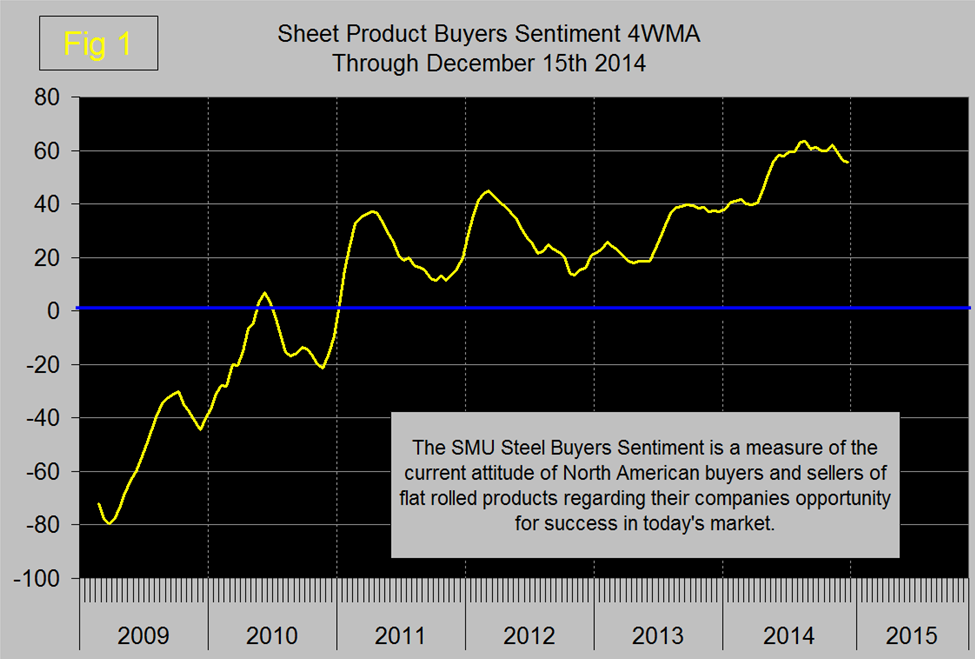
The SMU buyer’s sentiment index is a measure of the current attitude of North American buyers and sellers of flat rolled products regarding their company’s opportunity for success in today’s market. This index was at an all-time high in September at 61.0 and continued to be very strong through December 15th with a four week moving average of 55.5, Figure 1 shows the progression of the sentiment index since January 1st 2009. The buyer’s index is based on a survey of sheet producers and consumers and is not intended to be inclusive of long product market conditions.

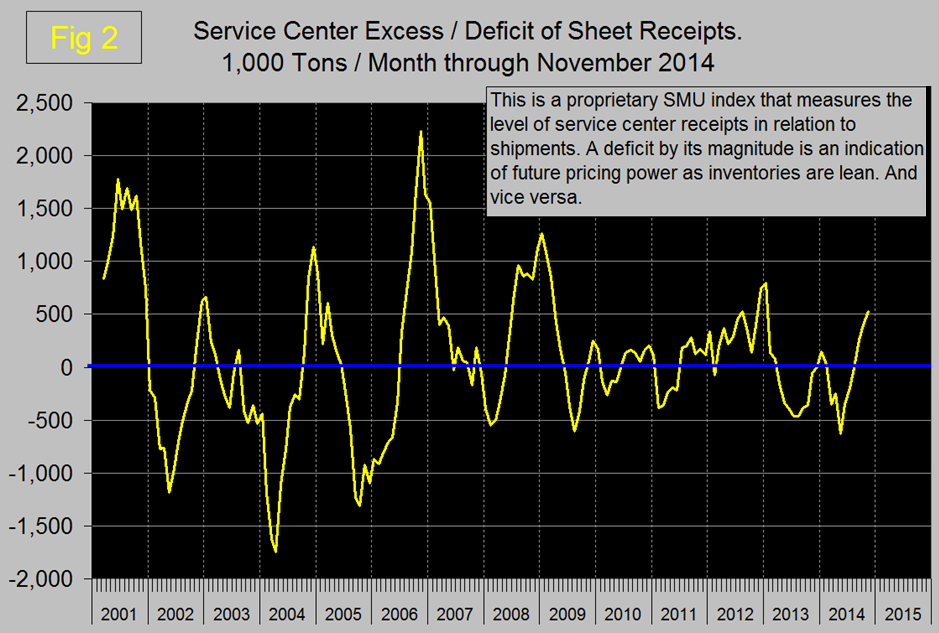
The service center excess continued to be in surplus which we regard as a negative for prices going forward as it suggests that service center inventories are on the high side. Figure 2 shows the progression of this index since January 2001.

In the raw materials section there are presently no positive indicators, three are negative and two are neutral.
The present situation of the flat rolled steel sector continues to be better than for long products. Net imports continue to be high for both sectors. Capacity utilization and apparent supply of long products have not been updated this month because we question the data provided through the SMA. On the face of it both capacity utilization and supply of long products crashed beyond belief in November so we will not publish until we can request a review after the holidays. Flat rolled capacity utilization and supply continued to be positive through October’s data. One quick visual indicator in Table 1 is to compare the present situation of raw materials with that of the US flat rolled section lower in the table. Clearly the US market situation is stronger than the global market which promotes imports.
Construction continues to be weak to neutral and manufacturing continues to be neutral to strong. Both nonresidential and residential construction starts are rated historically negative as is the total number of people employed in construction. The only indicator rated positive in the construction category is the producer price index of commodities which we believe to be highly correlated with industrial construction activity, particularly in the energy sector. It seems as though the commodity price index reported by the Bureau of Economic Analysis has yet to reflect the huge decline in the price of oil. None of the manufacturing indicators on a present situation basis are currently negative. Four are positive and one, manufacturing employment is neutral.
Trends. Twenty three of thirty six indicators are still trending positive which was no change from November’s update however there were several trend reversals of individual indicators. There was a decrease of one in the negative count. The price of Chicago shredded which had declined in November remained unchanged in December.
Changes in the individual sectors are described below. (Please note in most cases this is not December data but data that was released in December for previous months.)
In the general economy, the third release of GDP for Q3 released last week was revised up for the second time to a reported 5.0% Q/Q growth. This was a surprise on the upside though by our analysis the change was 4.88%. In Table 1, GDP growth is reported as 2.70% which is the year over year rate and which we believe is more indicative of the real situation. The Chicago Fed National Activity Index which had declined in slightly in October jumped strongly in November to 0.48 which is a historically high value. This indicator is a composite of 84 sub-indexes and which we believe to be a very credible measure of the direction of the economy. Consumer confidence as reported by the Conference Board in December bounced back from the November decline and November’s results were revised upward. Consumer confidence is now higher than the average value since 1980. There was no new data for bank lending standards in December. This data is reported quarterly by the Fed and will not be updated until early February.
The trends of both of the SMU proprietary indexes continued to be negative. The sentiment index was down from 62.3 on November 1st as described above but is still historically strong. The service center excess rose from 399,000 tons in October to 526,000 tons in November. This indicator was developed by SMU for sheet products and when in surplus indicates rising inventories and falling pricing power. SMU is forecasting an excess through March next year, this includes import material sitting on the docks.
Trends in raw materials changed significantly in the latest data. Chicago shredded held steady as mentioned above which is surprising to us. There has been a de-coupling between the price of scrap and the price of iron ore which we believe will be reconciled by falling scrap prices in the near future. The price of iron ore stabilized in December with only a small decline from the November level. On December 22nd the IODEX was $69.50 / dmt. Coking coal reversed direction in December with a decline of $1.15 after rising by $3.15 in November.
The price of Brazilian pig iron (an average of Brazilian N and S port exports FOB) also reversed direction in December and took back most of the November decline. The December pig price increased from $362.50 in November to $380.00 on December 26th. The price of zinc which had declined slightly in September picked up a cent in October and another in November then declined back to $0.982 on December 30th.
In the long products section, all indicators trended positive except for net imports which are still historically very high. Net imports of long products were zero in late 2011! It is possible that there was a major trend reversal in capacity utilization and supply of long products as mentioned above but we are holding our breath in the hope that the numbers reported are in error. Service center shipments increased for the eighth consecutive month but are still very depressed by historical standards.
In the flat rolled section there were no changes in the direction of trends. Capacity utilization increased by 0.3% to 86.7% in October and in three months through October supply increased at a rate <10 million tons per year compared to last year. This was the eighth straight month of increasing supply on a 3MMA basis. Net imports increased in October which is the latest month for which this data is available for the tenth straight month. Based on license data, imports of flat rolled decreased in November but the 3MMA continued to increase. Service center flat rolled shipments grew by 4.2% on a 3MMA basis year over year which was the sixteenth straight month of growth. Months on hand at the end of November at 2.87 increased more than the seasonal norm.
In the construction section there were no changes in the direction of trends, only one indicator, the price of commodities is trending negative. We regard this indicator as a driver of industrial construction which is still strong. Nonresidential and residential construction starts continue to improve but as we have reported elsewhere they both have a long way to go.
The seven month string where all manufacturing trends were positive was broken in this December report when the ISM index reversed direction and experienced a small, 0.1 decline. However the three month moving average of ISM manufacturing index was 58.1 in November which is historically strong and only 0.1 below the highest level since May 2011. The industrial production index and auto production continue to expand at a 4.7% and 3.73% rate respectively. Manufacturing employment grew by 171,000 year over year, less than construction which added 213,000 positions.
The key indicators analysis is still looking good in spite of this month’s decline in the present situation. SMU has several benchmark analyses that show steel demand has recovered more slowly than the general economy and is still not where it should be at this stage of a recovery. This is because the recession in non residential and housing construction was so extreme. Steel supply is now beginning to close the gap as construction slowly picks up the pace but imports are taking up almost all of the demand increase.
We believe a continued examination of both the present situation and direction is a valuable tool for corporate business planning.
Explanation: The point of this analysis is to give both a quick visual appreciation of the market situation and a detailed description for those who want to dig deeper. It describes where we are now and the direction in which the market is headed and is designed to give a snapshot of the market on a specific date. The chart is stacked vertically to separate the primary indicators of the general economy, of proprietary Steel Market Update indices, of raw material prices, of both flat rolled and long product market indicators and finally of construction and manufacturing indicators. The indicators are classified as leading, coincident or lagging as shown in the third column.
Columns in the chart are designed to differentiate between where the market is today and the direction in which it is headed. It is quite possible for the present situation to be predominantly red and trends to be predominantly green and vice versa depending on the overall direction of the market. The present situation is sub-divided into, below the historical norm (-), (OK), and above the historical norm (+). The “Values” section of the chart is a quantitative definition of the market’s direction. In most cased values are three month moving averages to eliminate noise. In cases where seasonality is an issue, the evaluation of market direction is made on a year over year comparison to eliminate this effect. Where seasonality is not an issue concurrent periods are compared. The date of the latest data is identified in the third values column. Values will always be current as of the date of publication. Finally the far right column quantifies the trend as a percentage or numerical change with color code classification to indicate positive or negative direction.


