Market Data

November 23, 2014
Flat Rolled Steel Demand: Seasonal Weakness or New Leg Lower?
Written by John Packard
Last week Steel Market Update (SMU) conducted our mid-November flat rolled steel market survey. We invited approximately 600 companies to participate representing manufacturing, steel service centers, trading companies, steel mills, toll processors and suppliers to the steel industry. Last week’s participation mix was very similar to what we see on a regular basis with 46 percent of the respondents being from manufacturing, 40 percent from service centers, 6 percent steel trading companies, 5 percent steel mills and 3 percent toll processors.
The way our steel surveys work is we have a group of questions where we want to collect responses from everyone, after which we break out each group to respond to industry specific questions. This provides us with data regarding over-all trends and then we can drill down by market segment in order to get more clarity on the subject.
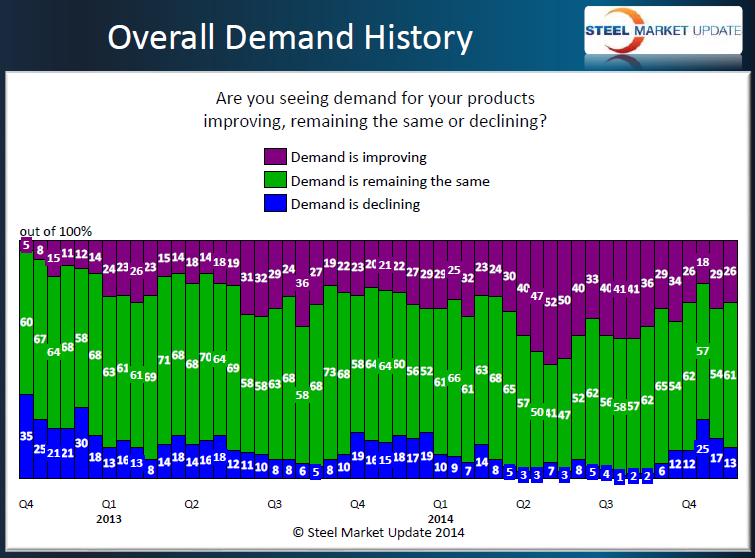
One area we watch carefully is market demand for the products being sold by those involved. Earlier this year we saw our respondents reporting demand as improving. Beginning in late 3rd Quarter and now extending into 4th Quarter we are seeing the percentage of those reporting improving demand as being 15-25 percent lower than what we saw during 2nd Quarter and into early 3rd Quarter 2014.
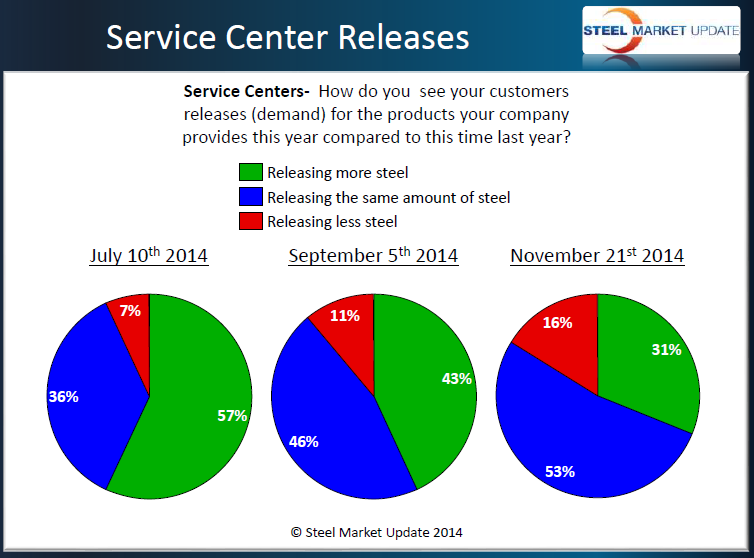
As we begin the process of separating out the various groups we are looking for clarification to see if there is a specific group that is impacting the overall demand numbers more than another. As we look at the service center data we see this market segment as reporting lower demand from their customers. We have broken out three data points: early July, September and now mid-November (see graphic).
SMU is of the opinion that a portion of our data is being influenced by normal seasonal influences but, as you can see by the first graphic those reporting improving demand was much more robust in 2014 than what we saw in 2013.
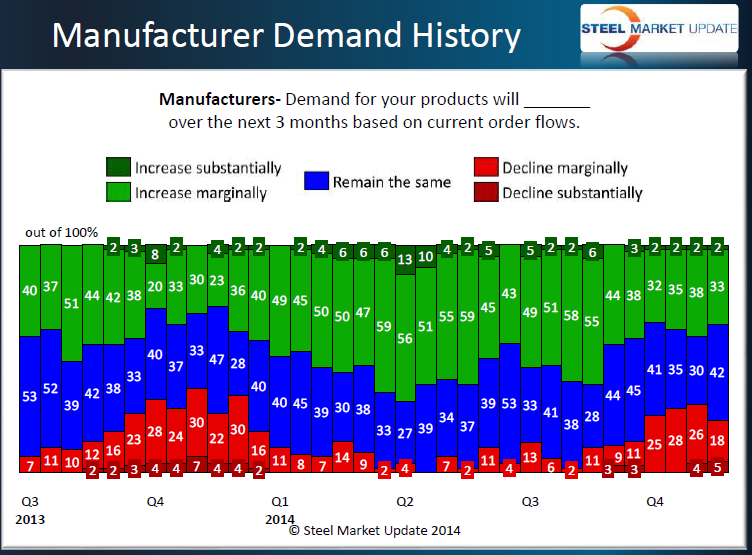
We can better see the seasonal influence on our results by looking at the manufacturing responses from 3rd & 4th Quarter 2013 and then this calendar year to date. SMU expects that the business cycle will repeat what we saw late last year and into 1st Quarter 2015. However, there are some concerns as the rest of the world struggles to grow.
The warning signs that we are seeing in the domestic market are related to the strength of the dollar versus other currencies. This strength is impacting the price of oil, iron ore and scrap. It is making our exports more expensive and will make imports more desirable for both finished products and steel.
So far the resiliency of the U.S. economy has allowed steel prices to remain relatively stable during 2014. We have seen benchmark hot rolled, which at this time last year was $670 per ton or $35 per ton higher than where we are today, move within a relatively tight trading range. Since mid-November 2013 the peak for HRC was $685 per ton achieved during the beginning of May with the low point being $620 per ton recorded in early March.
We will have more about iron ore, scrap and steel prices in our next article.


