Market Data

October 11, 2014
Currency Update for Steel Trading Nations
Written by John Packard
The following article was produced by SMU contributing writer Peter Wright for our Premium level members. However, we felt that the current strengthening trend of the U.S. dollar is important for all of our readers to understand as it is impacting both commodity and steel prices and will continue to do so in the future.
Explanation of Data Sources
The broad index is published by the Federal Reserve on both a daily and monthly basis. It is a weighted average of the foreign exchange values of the U.S. dollar against the currencies of a large group of major U.S. trading partners. The index weights, which change over time, are derived from U.S. export shares and from U.S. and foreign import shares. The data are noon buying rates in New York for cable transfers payable in the listed currencies.
At SMU we use the historical exchange rates published in the Oanda Forex trading platform to track the currency value of the US $ against that of sixteen steel trading nations. Oanda operates within the guidelines of six major regulatory authorities around the world and provides access to over 70 currency pairs. Approximately $4 trillion US $ are traded every day on foreign exchange markets.
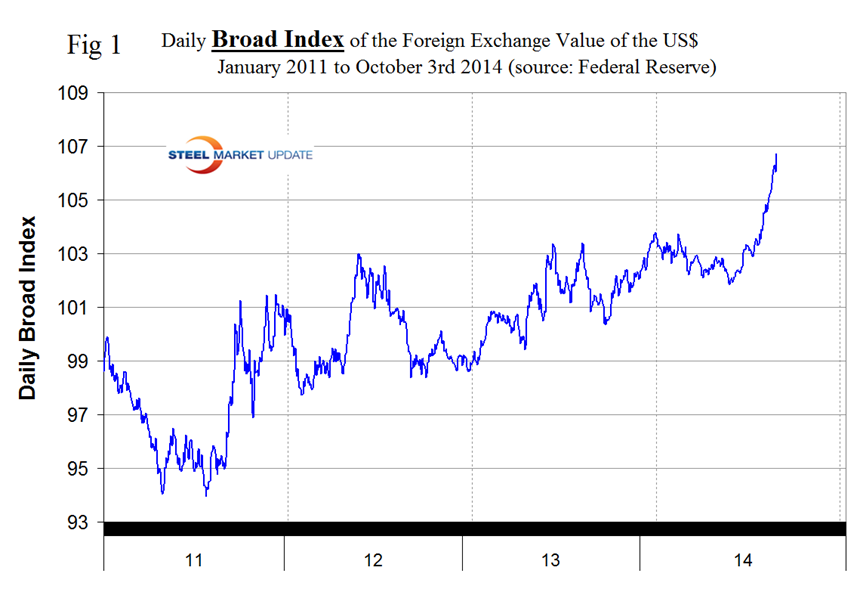
Based on the daily Federal Reserve Broad Index value of the US $ against our major trading partners we see a strengthening trend that has existed for the last three years. On February 3rd 2014, the value for the dollar was 103.8026, the index then weakened, turned around at mid-year and on October 3rd (the last date published by the Fed) had achieved the highest value of the year at 106.7043, and through October 3rd was going straight north. (Figure 1).
The Broad Index has strengthened by 4.6 percent in the last three months, 2.6 percent in the last month and 0.4 percent in the last seven days. It does not necessarily follow that the currencies of the steel trading nations follow the Broad Index but in the last month and three months this has been the case.
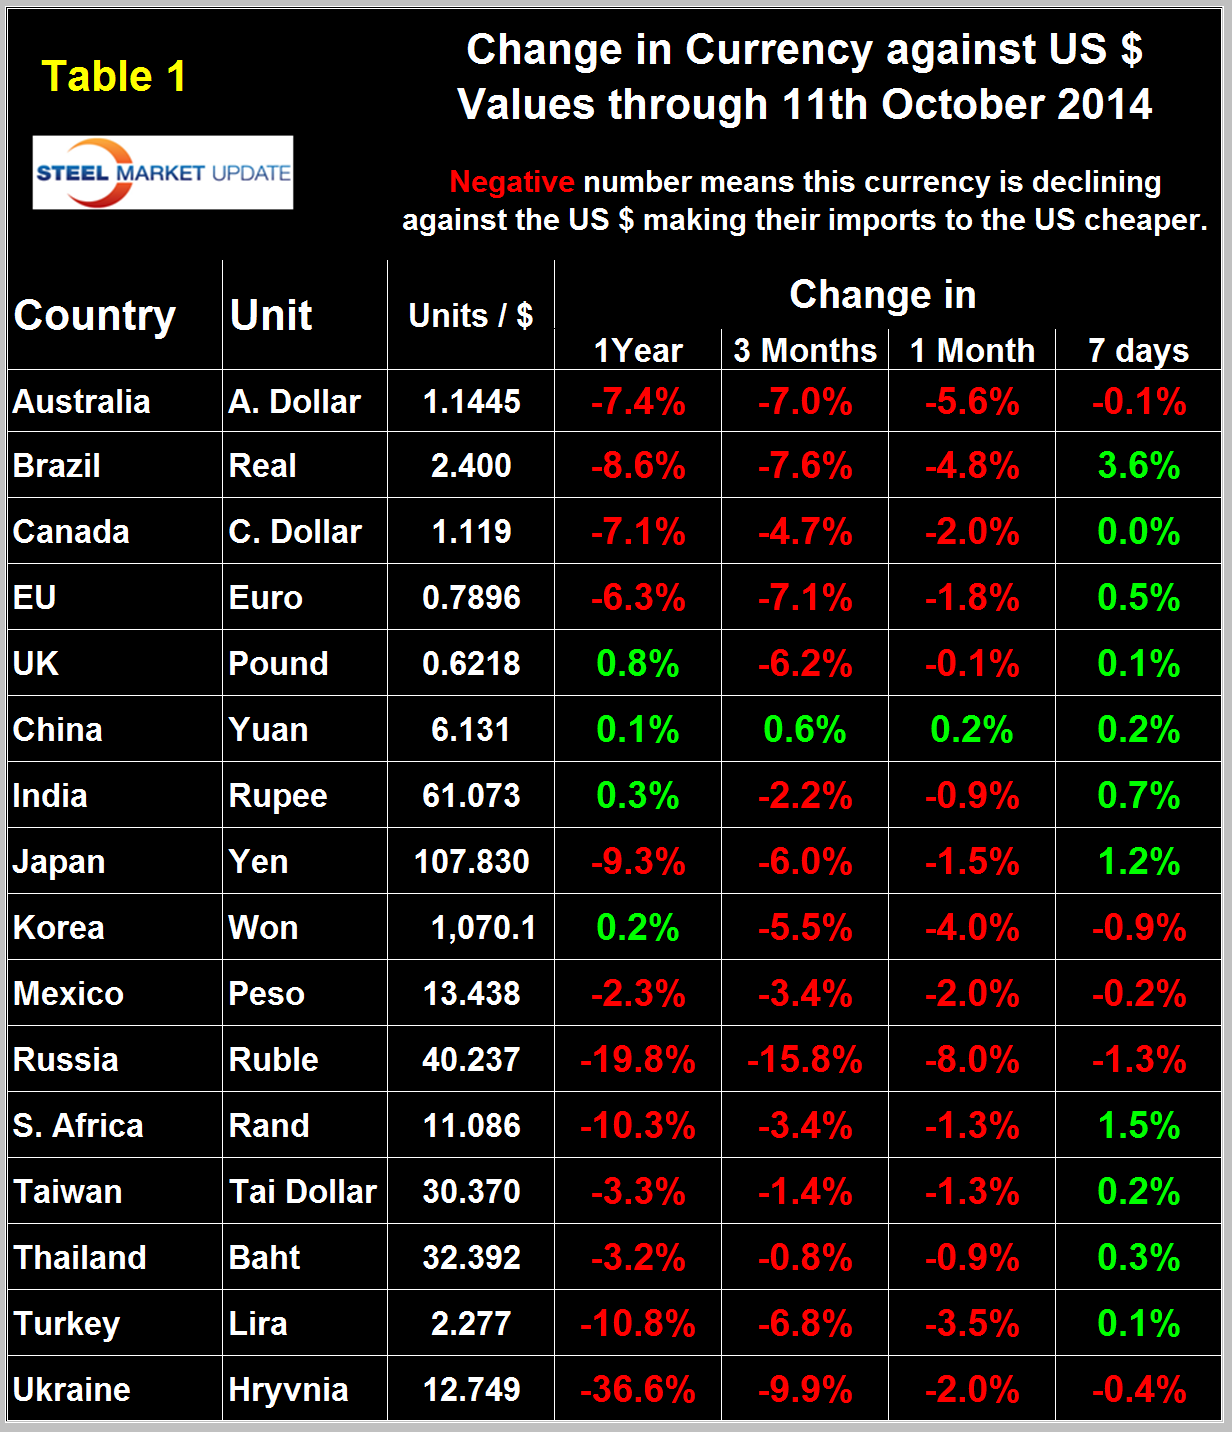
In the last seven days the dollar has declined against eleven of the sixteen steel trading nations and since the national Oanda data is eight days more current that the Fed Broad Index it may be that the BI will weaken when updated. Table 1 shows the number of currency units of steel trading nations that it takes to buy one US dollar and the change in one year, three months, one month and seven days. Negative values for change indicate that the dollar is strengthening against a particular currency. In the last three months and one month through October 11th, the dollar has strengthened against 15 of the steel trading currencies but in the last seven days has reversed course and weakened against 11. Table 1 is color coded to indicate strengthening of the dollar in red and weakening in green. We regard strengthening of the US Dollar as negative and weakening as positive because the effect on net imports.
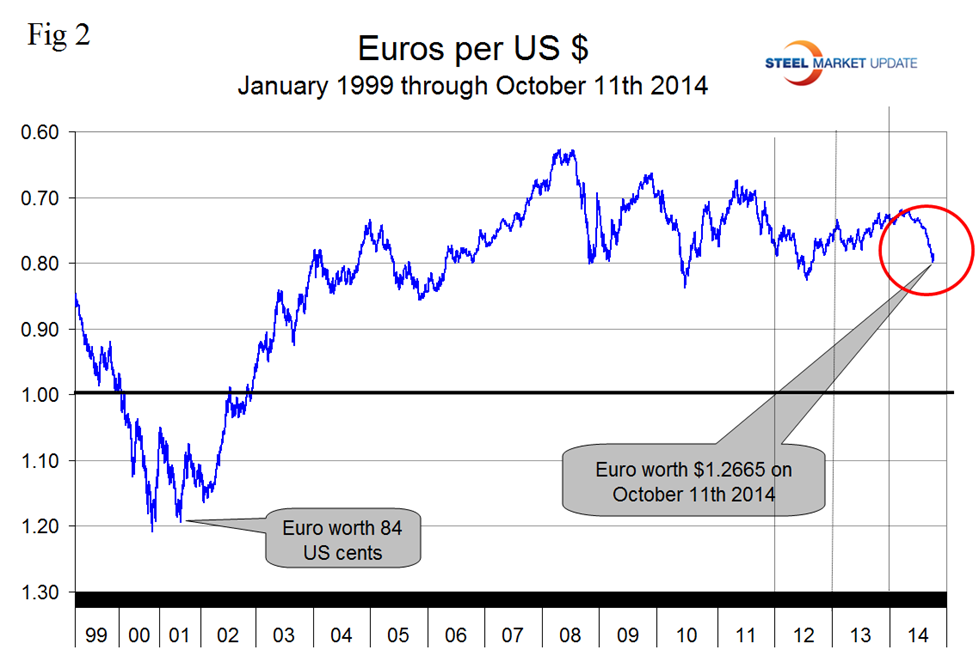
On September 6th the Euro broke through the 1.3 US $ / Euro level for the first time since July 11th last year and closed at 1.2665 on October 11th. On October 5th and 6th the Euro had declined to almost 0.8 per US $ closing both days at 0.799 before recovering slightly to 0.7896 on the 11th, (Figure 2).
The Euro has now declined by 8.1 percent against the US$ YTD, by 7.1 percent in the last three months, by 1.8 percent in the last 30 days through October 11th and in the last seven days has recovered by 0.5 percent . A devalued Euro means that US exports will be more expensive in Europe and European exports will be cheaper here. This is particularly true for steel trade. In addition European scrap will be more attractive to Turkish buyers than supplies from the US which will put downward pressure on domestic scrap prices.
On September 30th, Stratfor Global Intelligence reported: “Since the beginning of the crisis, Germany has managed to keep the Eurozone alive without substantially compromising its national wealth, but the moment will arrive when Germany must decide whether it is willing to sacrifice a larger part of its wealth to save its neighbors. Berlin has thus far been able to keep its own capital relatively free of the hungry mouths of the periphery, but the problem keeps returning. This puts Germany in a dilemma because two of its key imperatives are in contradiction. Will it save the Eurozone to protect its exports, writing a big check as part of the deal? Or will it oppose the ECB moves, which if blocked could mean a return to dangerously high bond yields and the return of rumors of Greece, Italy and others leaving the currency union? The case will prove key to Europe’s future for even deeper reasons. The European crisis is generating deep frictions in the Franco-German alliance, the main pillar of the union. The contrast between Germany, which has low unemployment and modest economic growth, and France, which has high unemployment and no growth, is becoming increasingly difficult to hide. In the coming months, this division will continue to widen, and Paris will become even more vocal in its demands for more action by the ECB, more EU spending and more measures in Germany to boost domestic investment and public consumption. This creates yet another dilemma for Berlin, since many of the demands coming from west of the Rhine are deeply unpopular with German voters. But the German government understands that high unemployment and low economic growth in Europe are leading to a rise in anti-euro and anti-establishment parties. The rise of the National Front in France is the clearest example of this trend. There is a growing consensus among German political elites that unless Berlin makes some concessions to Paris, it could have to deal with a more radicalized French government down the road. The irony is that even if Berlin were inclined to bend to French wishes, it would find itself constrained by institutional forces beyond its control, such as the Constitutional Court. Germany has managed to avoid most of these questions so far, but these issues will not got away and in fact will define Europe in 2015; the Alternative for Germany, for example, is here to stay. Meanwhile, the Constitutional Court will keep challenging EU attempts at federalization even if this specific crisis is averted, and the Bundesbank and conservative academic circles will keep criticizing every measure that would reduce German sovereignty to help France or Italy. Though it is impossible to predict the European Court of Justice’s final ruling, either way, the dilemma will continue to plague an increasingly fragile European Union.”
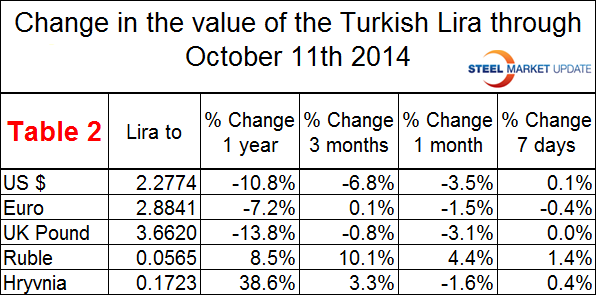
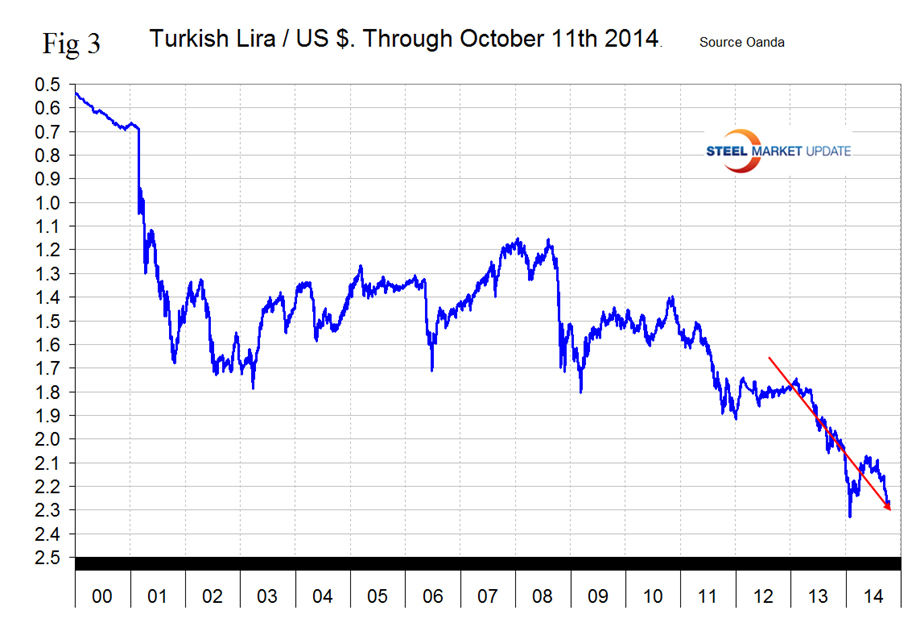
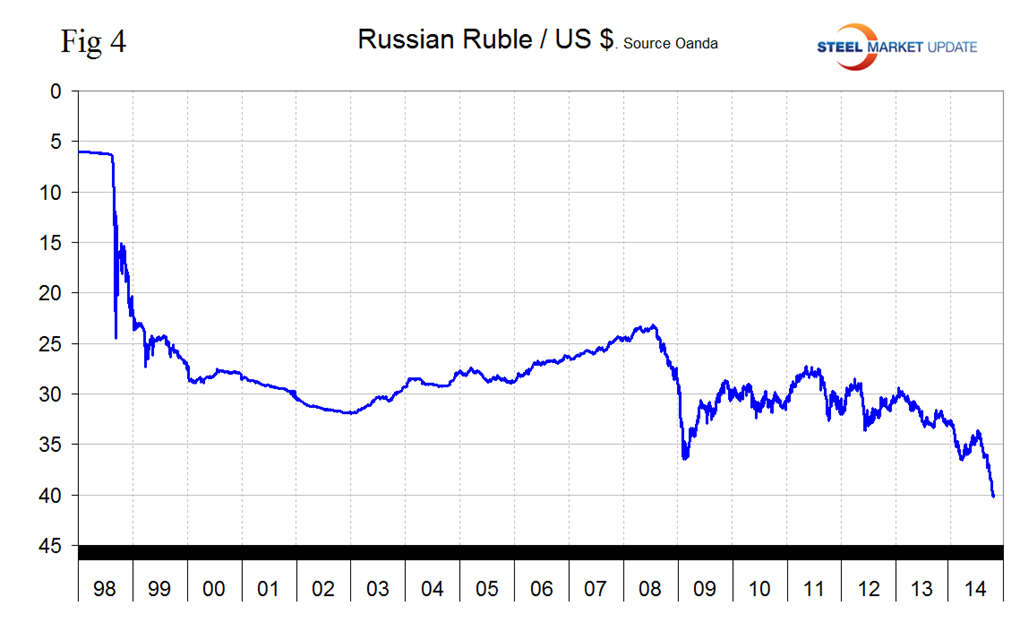
Table 2 shows how the value of the Turkish Lira has changed against its major scrap and or semi-finished suppliers. The US position as a scrap supplier has deteriorated strongly in the last three months as the Dollar has strengthened against the Lira. In the same period the Euro has been almost unchanged but Russian Ruble has declined by 10.1 percent making purchases in Russia that much more attractive.
Figure 3 shows the downward trend of the Lira against the Dollar since January 2013.
The Russian Ruble has had the largest decline of all the steel trading nations in the last three months being down by 15.8 percent against the Dollar, (Figure 4).
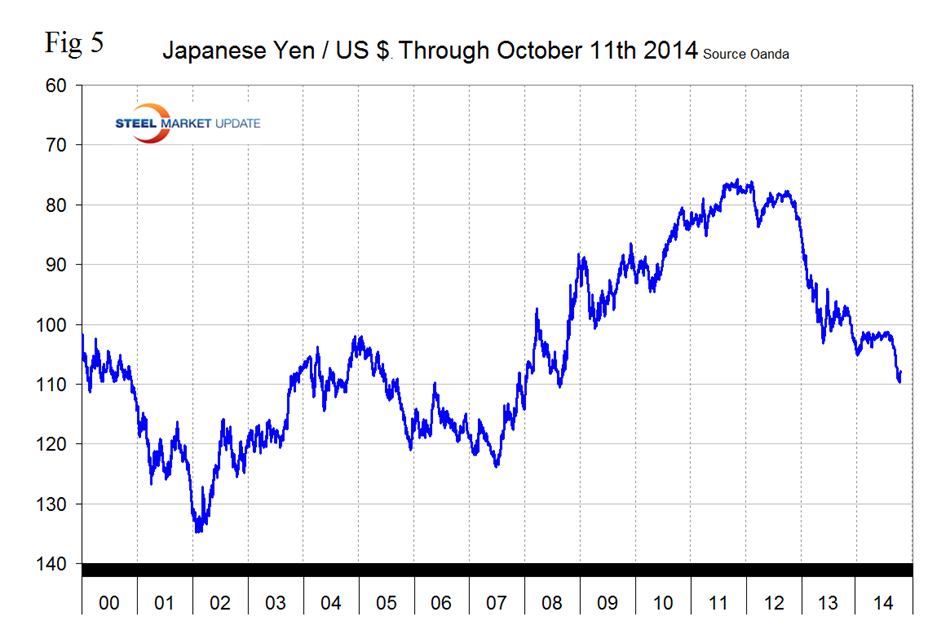
The Japanese yen did not quite break through the 110 level this month closing at 109.75 on the 5th and 6th. By the 11th the yen had recovered to 107.83, (Figure 5). The Yen is down by 9.3 percent in 12 months and 6 percent in 3 months. Some analysts are predicting a level of 200 Yen / Dollar in the not too distant future.
John Saucer of Mobius Risk group reported in Seeking Alpha last week that Japan has been battling economic stagnation and deflationary pressure for well over a decade. Japan like its EU counterparts, is running out of fresh options. The Bank of Japan has maintained an aggressive program of quantitative easing via bond purchases with the most recent round begun in April. At present, BOJ is purchasing ¥6 to ¥8 trillion (US $55-$75 billion) of government bonds per month and, with some of its September purchases, the BOJ drove 3-month interest rates into negative territory.
The latest government inflation estimates do not suggest much of a boost from the latest move to bolster liquidity by the BOJ. Japanese Core Consumer Inflation in August was up 3.1 percent versus 3.2 percent in July. Netting out the effect of the second quarter hike in national sales tax these numbers shake out to about 1.1 percent and 1.2 percent respectively. The purchase of a yield less than zero underscores the BOJ’s willingness, like the ECB’s Draghi, to do “whatever it takes” to battle deflation and stimulate the economy.
It is expected the BOJ will continue to buy ¥ 65 trillion per year of assets through at least 2015. Additional tools waiting in the wings also include the BOJ shifting purchases to REITs and mortgage-backed securities to help bolster broader asset values. Japanese insurance companies and the country’s largest pension, Government Pension Investment Fund (GPIF) have signaled their intention to shift investment assets out of Japanese government bonds and into equities and other investments. This will free up some new capacity to meet the bond buying appetite of the BOJ in the months ahead. But it also marks an expected shift to increased exposure to and demand for non-Yen based asset classes. The shift from Yen denominated assets parallels a similar shift evident in global investor portfolios and global reserve managers’ preferences to shift away from Euro denominated risks. Neither trend looks set to reverse anytime soon. In fact, they may accelerate some over the next few months. All of which puts the US dollar in a unique and well supported position and make it a very difficult path for commodities.
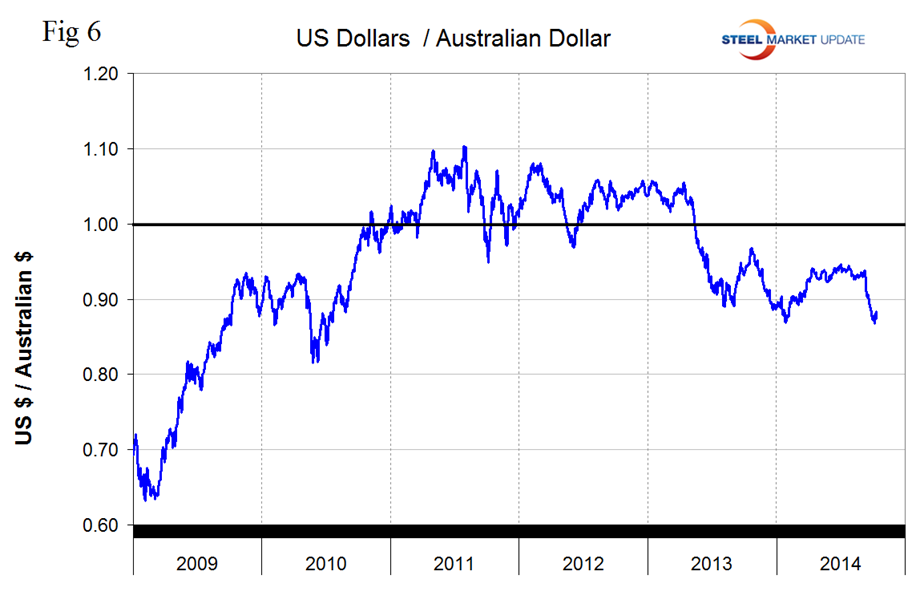
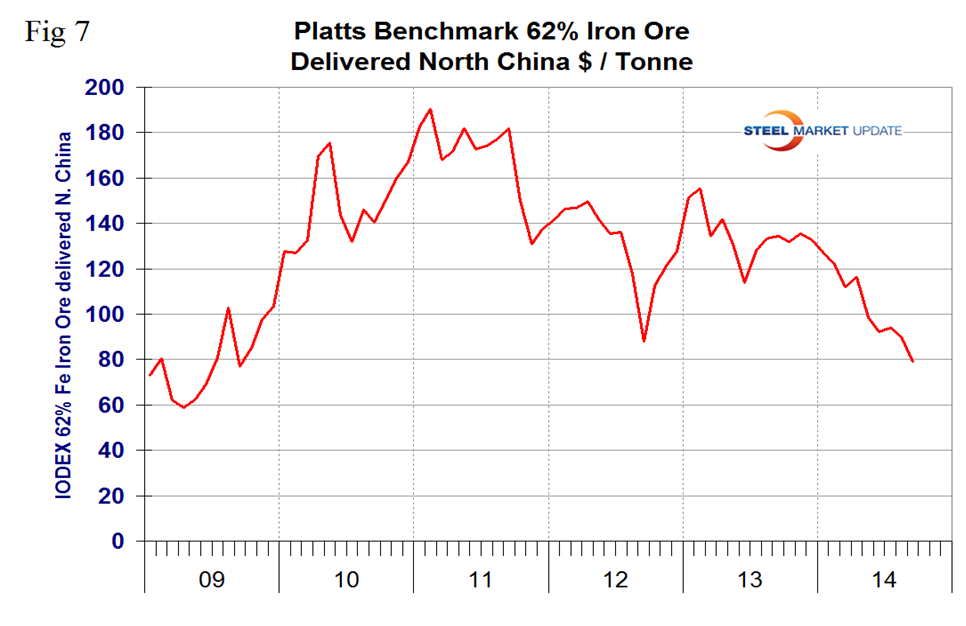
Which brings us to the Australian Dollar, (Figure 6). We are struck by how much the value of the Australian dollar curve looks like the IODEX value of iron ore, (Figure 7). At a later date we will do a correlation of this data but on first glance it looks very close. A declining Australian $ makes iron ore cheaper on the global market which may be a downward spiral since iron ore exports are such a significant part of the Australian economy and last week the World Steel Association reduced China’s steel demand forecast to a 1.0 percent growth rate next year and 0.8 percent in 2016.
SMU Comment: Interesting times in the currency markets that steel company executives should be keenly aware of. In this monthly analysis we show the trends that we think have the most immediate significance, but all 16 steel trading nation graphs are available on request if any reader has a special interest that we haven’t covered.


