Market Data

June 13, 2014
Currency Update for Steel Trading Nations - June 10th 2014
Written by Peter Wright
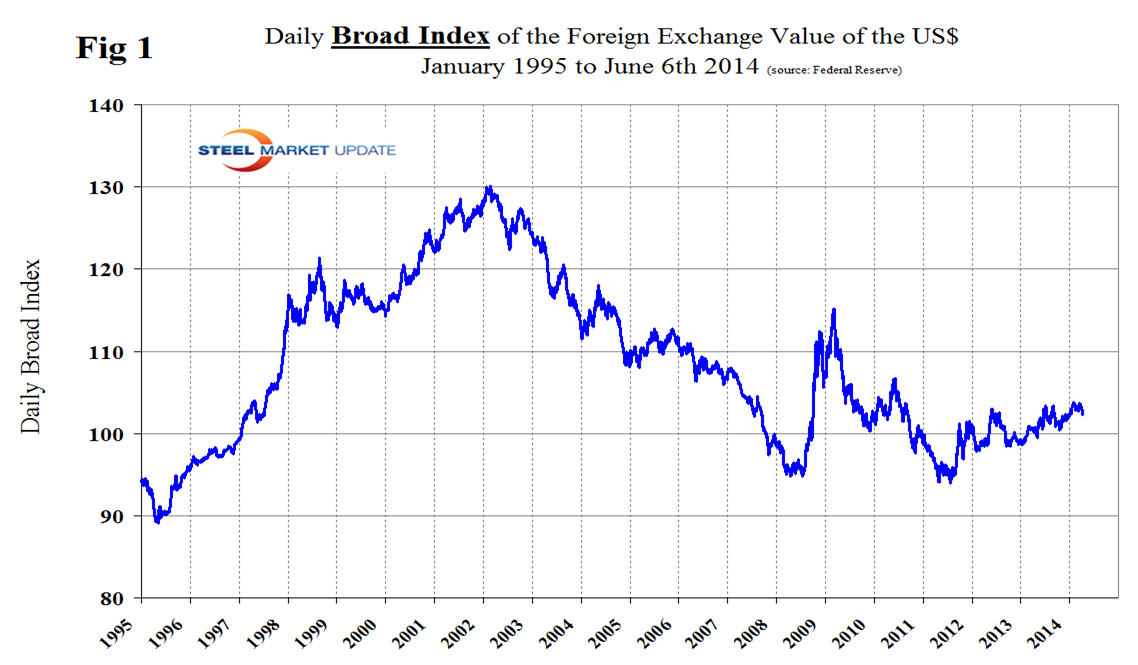
The Broad Index value of the US $ has been gradually strengthening for 18 months, (Figure 1) which favors imports to the US and depresses exports. See explanation at the end of this piece. The currencies of the steel trading nations have been fairly stable over the last month.
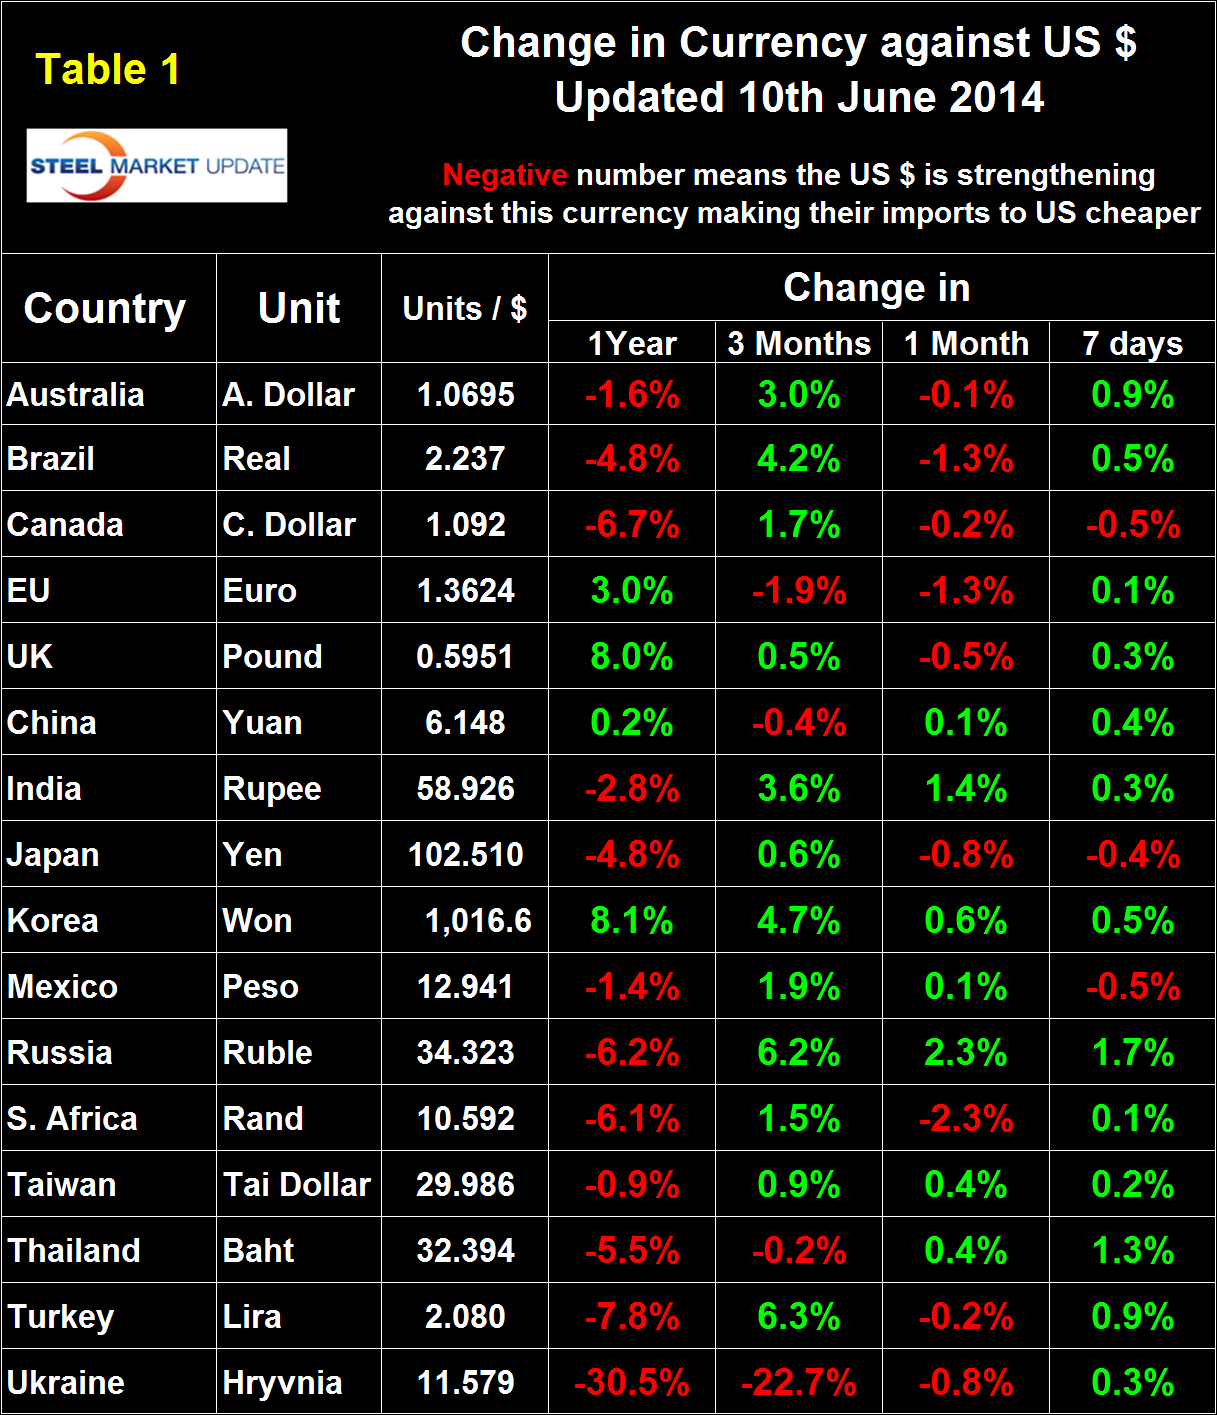
Table 1 shows the number of currency units that it takes to buy one US $ and the percent change in the last year, three months, one month and seven days. In the last year the US $ has strengthened against twelve of the currencies of the major sixteen steel trading nations. Table 1 is color coded to indicate strengthening in red and weakening in green. We regard strengthening as negative and weakening as positive because the effect on net imports. In the last month the US $ has strengthened against nine of the currencies of steel trading nations. In the last seven days the situation has reversed with the dollar weakening against thirteen of the other steel trading currencies.
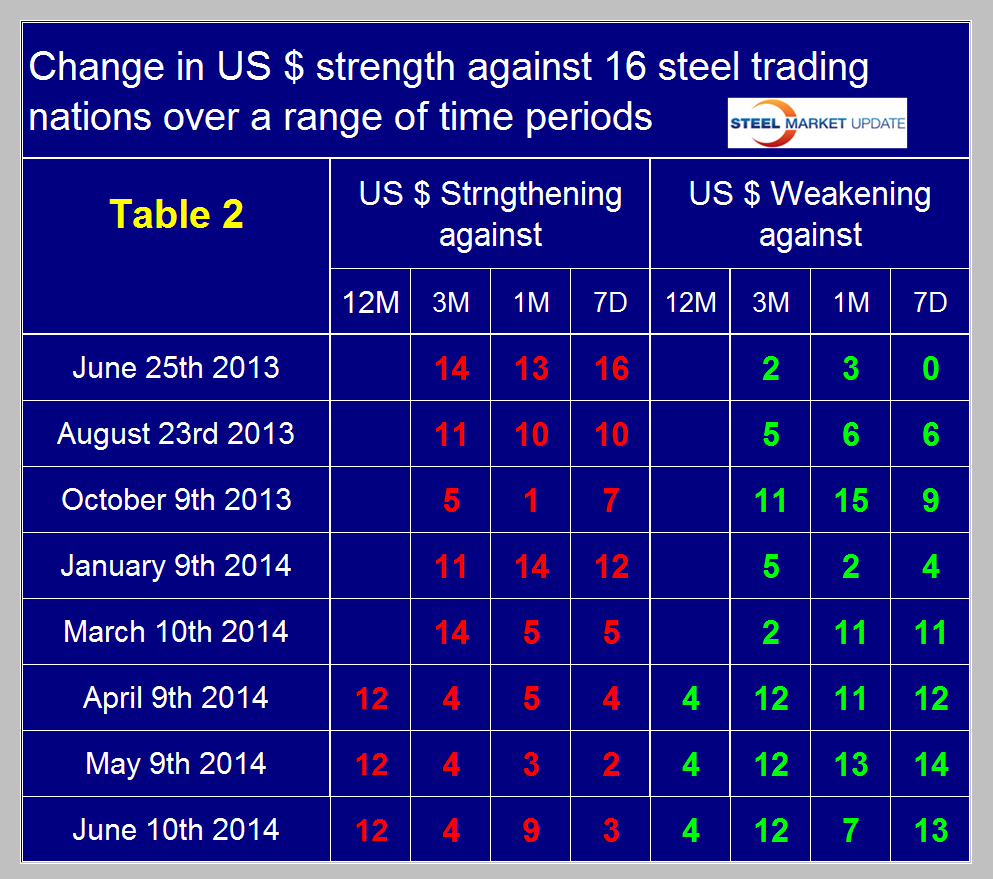
Table 2 attempts to clarify the overall change in the currency values of the sixteen steel trading nations and summarizes the points made above about direction over time.
In the last year the currencies of the major iron ore producing nations, Australia and Brazil have been bouncing from weakened to strengthening against the US$. In the last three months both have strengthened by 3.0 percent and 4.2 percent respectively. An increase in these currencies tends to support the global price of iron ore which is traded in US dollars.
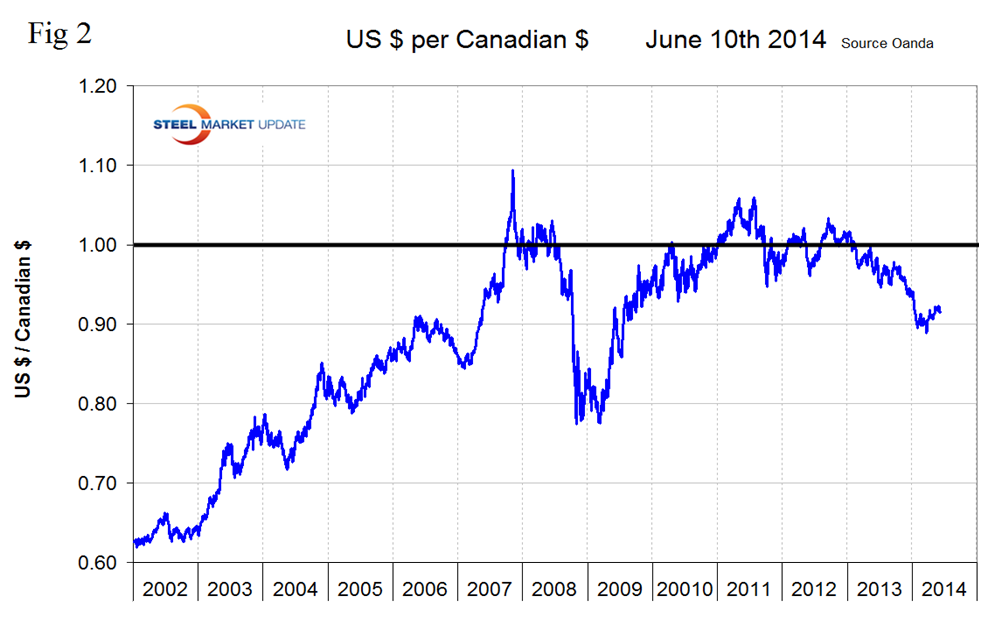
In the last 12 months the US $ has strengthened by 6.7 percent and 1.4 percent against the Canadian $ and the Mexican Peso respectively. However the long term picture of the C $ is that it has been weakening against the US $ for the last two years, (Figure 2).
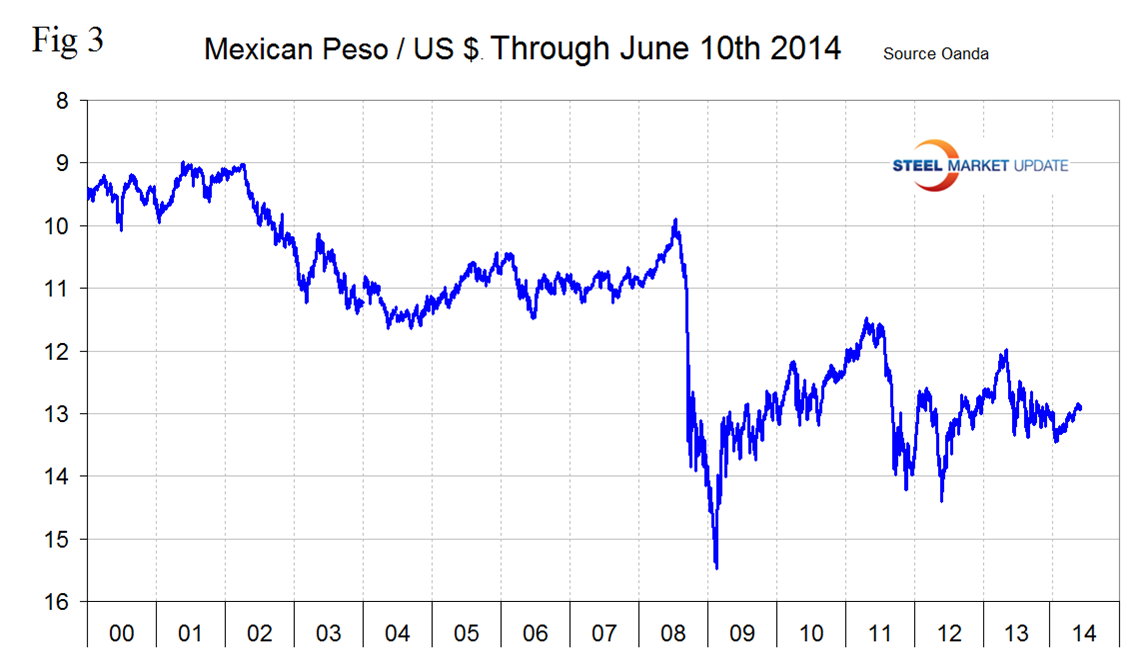
The Mexican peso trended down last year but has reversed course in 2014, (Figure 3).
The Euro stood at 1.3624 on June 10th down from 1.3924 on May 8th. The Euro has as strengthened steadily for two years and by 3.0 percent against the US $ in the last twelve months. A strengthening Euro makes US scrap more attractive to Turkish buyers than alternative sources in Europe and tends to suppress European steel exports to the US.
The Chinese Yuan peaked at 6.0987 on February 15th and has since weakened to 6.1482, a decline of 0.8 percent. In the last month the variation has been only 0.1 percent. We understand that the policy of strengthening the Yuan that existed since Q3 2010 has been abandoned and that the currency will float more freely in future.
The Indian Rupee has regained some of the severe depreciation that occurred in mid-2013. In the last three months the Rupee has appreciated by 3.6 percent.
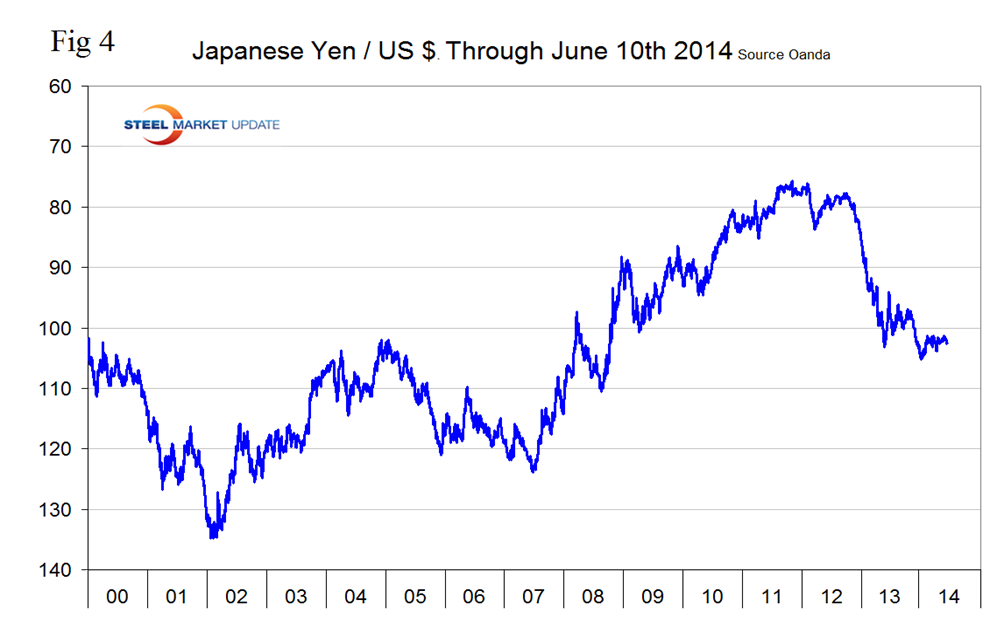
The Japanese Yen is currently trading at 102.5 to the dollar and has been flat for the last three months, (Figure 4). There has been very little recovery from the sharp decline of last year.
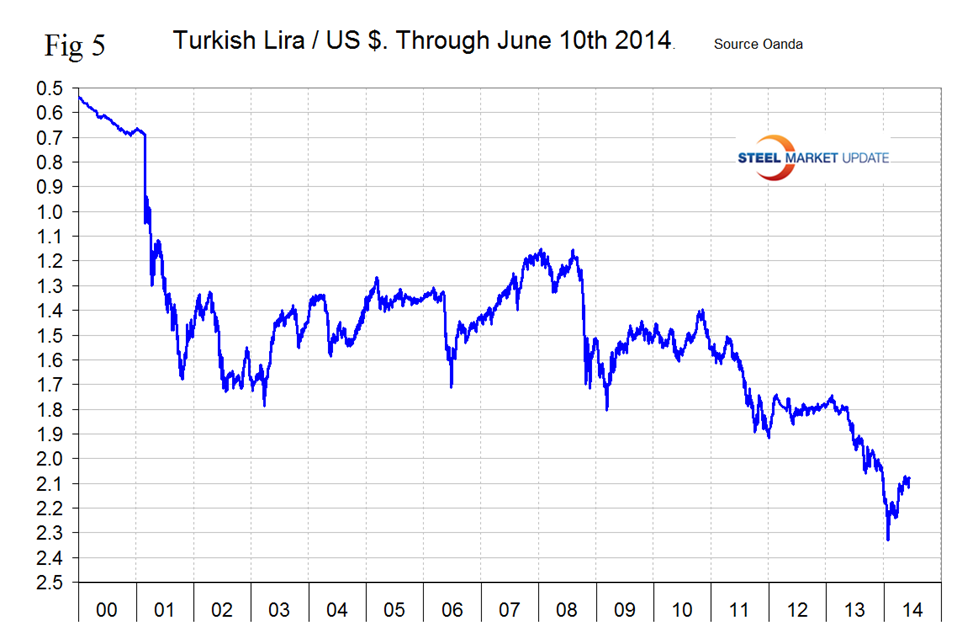
The Turkish Lira has been recovering for almost all of this year and is up by 6.3 percent in the last three months. It currently stands at 2.080 Lira to the dollar, up from its all-time low of 2.3299 / US $ on January 26th, (Figure 5).
The Ukrainian Hryvnia has bounced back some after its disastrous fall during the Crimean situation. Over three months it is down by 22.7 percent. The Hryvnia bottomed out at 12.7 / US $ on April 15th and has since recovered to 11.6 to the dollar.
This writer returned from three weeks in Europe on Monday and concluded that the Euro is highly overvalued compared to the dollar on a purchasing power parity basis. Given the economic uncertainties in the world and the performance of the European economy it seems that the reverse should be the case. Low interest rates on US treasuries send global investors on a hunt for higher yields but this doesn’t explain the strength of the Euro.
The Armada Executive Briefing commented as follows last week. 10 Year Treasury. This is an oversimplification of bond prices and the function of 10 year treasuries, but, we look at the ten year from a global attractiveness perspective. Essentially, the higher the yield on the 10 year, the more return (interest) investors are requiring before they will take a chance on the bond. The lower the rate, the more investor buying interest we see in the bond. So, as treasury rates rise, we believe that either A) there’s something more attractive to put money into (perhaps equities, other global treasuries, sell-offs altogether to cash, etc.) or there’s a lot of fear in the US Treasury. For now (as updated this month), the DJIA continues to set records. Government bond auctions have to be strong in order to attract investors – and we are seeing the interest rate move up probably because of that. But, uncertainty in Ukraine and other global issues can drive volatility into the market – and as it does the US Treasury will strengthen (and the rate for the bond will drop). For most of 2014, it has remained somewhat flat, but rose from mid-2012 to date.
Explanation of Data Sources: The broad index is published by the Federal Reserve on both a daily and monthly basis. It is a weighted average of the foreign exchange values of the U.S. dollar against the currencies of a large group of major U.S. trading partners. The index weights, which change over time, are derived from U.S. export shares and from U.S. and foreign import shares. The data are noon buying rates in New York for cable transfers payable in the listed currencies. At SMU we use the historical exchange rates published in the Oanda Forex trading platform to track the currency value of the US $ against that of sixteen steel trading nations. Oanda operates within the guidelines of six major regulatory authorities around the world and provides access to over 70 currency pairs. Approximately $4 trillion US $ are traded every day on foreign exchange markets. Currencies of the steel trading nations as reported by Oanda do not necessarily track with the Federal Reserve Broad Index and in fact often move in the opposite direction.


