Market Data

May 21, 2014
Service Center Inventory Deficit at 251,000 tons
Written by Brett Linton
Every month, Steel Market Update calculates whether flat rolled steel distributor’s inventories are in excess or a deficit based on our proprietary formula. The Metal Service Center Institute released April data late last week and, based on our analysis, we believe the “apparent deficit” to be 251,000 tons. This represents an improvement of 101,000 tons from the calculated apparent deficit of 352,000 tons noted the previous month (March).
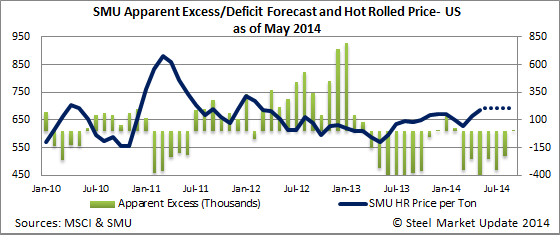
For reference, a figure of zero means distributor inventories are perfectly balanced. We find that when inventories are in deficit – especially large deficits – then spot prices tend to be firm and the domestic steel mills are able to move prices higher (or at least maintain existing price levels). As inventories move into an excess position there is pressure on spot pricing.
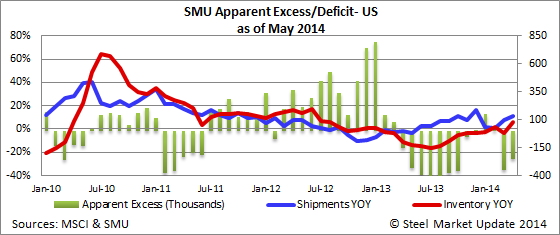
The year 2014 started off with an excess of 150,000 tons in January, dropping to +28,000 tons in February, and by March service center inventories had moved into an apparent deficit of -352,000 tons. This month is the first ‘up-tick’ or improvement in inventories so far this year.
Out of curiosity we did an analysis of what we were finding with inventories during the same time period last year. In January 2013, service centers were holding a massive excess of flat rolled steel inventories with an apparent excess of 796,000 tons. During the month of February service centers were able to reduce the apparent excess down to 142,000 tons. By April the distributors were able to reverse the trend and moved into an apparent deficit of 157,000 tons and the deficits continued until August.
In the graphic below we track hot rolled steel price movement and service center inventories. As you can see, as prices moved into deficit during 2013 prices began to rise (albeit modestly). We are seeing the same price movement with the deficits recorded so far this year. We are forecasting a relatively flat price cycle through the September time period.

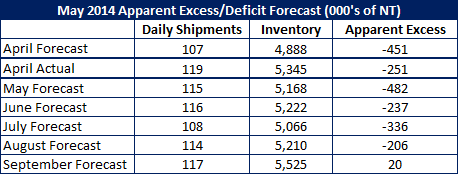
Last month we used a future estimate of daily shipments and inventory levels to forecast the apparent excess model throughout July. Our forecast of -450,000 tons turned out to be exactly 200,000 tons lower than what final data revealed. This is due to both daily shipments and inventory being much higher in April than we had anticipated.
If May daily shipments remain the same as April at 118,800 tons per day, we forecast that it will take an inventory level of 5,721,000 tons in May to have a perfectly balanced inventory. We do not believe this will be case for shipments. We are forecasting May service center shipments will be up 6 percent over 2013 which would be 115,400 tons per day. We are carrying this 6 percent increase for each month through our September forecast. This might be a bit aggressive (6 percent) as construction continues to struggle but lets give it a try.
Inventory is forecast to be lower in May to 5,167,700 tons. These estimates use an adjusted steel receipt rate based on 2013 levels with additional tonnage from foreign imports added in. Based on production numbers so far this year we are not seeing any significant changes in domestic production and we believe the increases in inventories to be from the rise in imports. For the months of May and June we have added 200,000 tons of foreign imports to service center inventories. In July and August we added only 100,000 tons, before raising September to 200,000 tons. Again, our estimates may be too low as imports may be much higher than what we are forecasting at this moment.
When you put these estimates together, you get our forecast apparent excess model throughout September. We see inventory levels remaining in a deficit state through August and then moving to an excess state in September.


