Overseas

May 15, 2014
Domestic vs. World Export Hot Rolled Price Spread Widens
Written by Brett Linton
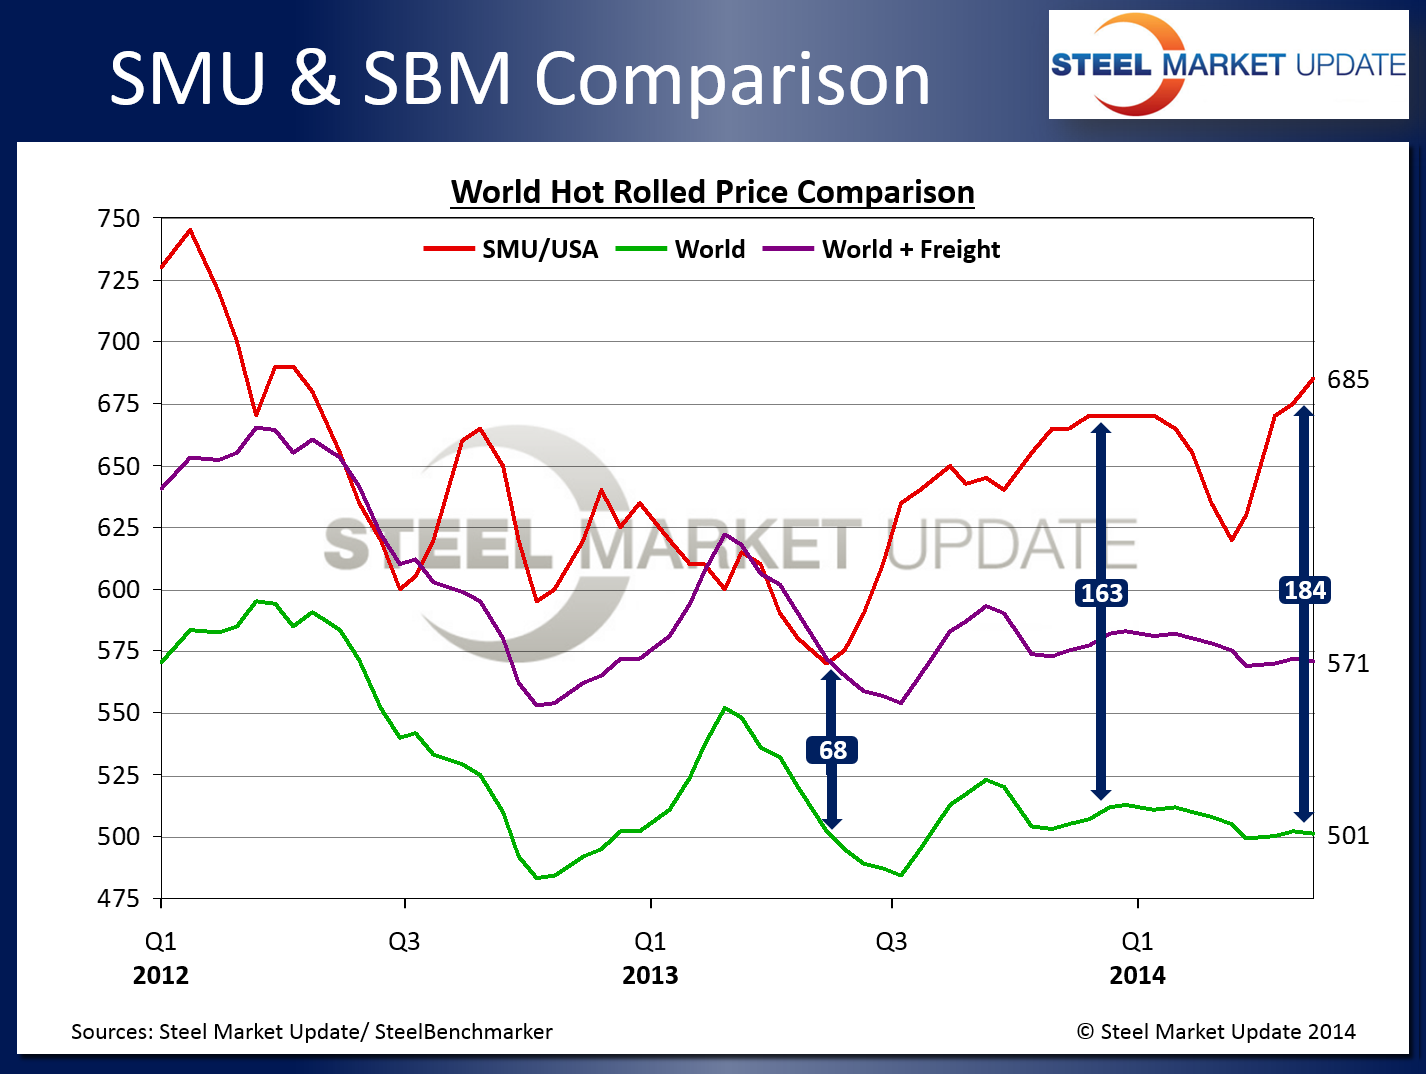
SteelBenchmarker released regional pricing earlier this week, putting the world export hot rolled price at $501 per net ton ($552 per metric ton). The spread between the SMU HR price and the world HR price went from $173 per ton two weeks ago to $184 as of Monday. With an estimated $70 per ton in costs deducted from this spread for freight charges and other import duties, the spread for this week is $114 per ton, up $11 from $103 two weeks ago.
The current world HR export price at $501 per ton is a decrease of $1 over two weeks ago and also $1 lower than the $502 recorded during the same time last year. While world hot rolled export prices may be similar to last year the domestic (USA) hot rolled average is not even close to being the same. The SMU HR price is currently at $685 per ton, an increase of $10 per ton compared to two weeks ago, and an increase of $115 compared to the same time last year.
When looking at the graphic below, the $68 per ton spread was recorded on May 13th of last year. Since that time, the spread between world export pricing and domestic HRC pricing has been expanding. The net result has been an invitation to the world community to export steel to the United States.
Steel Market Update dug a little deeper this week because we wanted to see if there was any evidence that as the spread between domestic and foreign export prices widens is there an impact on foreign steel imports into the United States. To make it easier on everyone, we took a snippet of one of our interactive graphs which shows imports. It is our opinion that the widening of the spread between world export and U.S. spot pricing has created more volatility and, over time, has increased the amount of tons being received from outside the U.S. on hot rolled, cold rolled, galvanized and Galvalume products. Here is what that graph looks like:
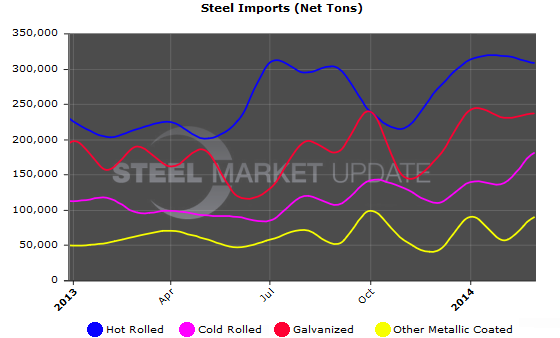
For those of you who are able to log into our website, you have the ability to manipulate this graphic by increasing or decreasing the time period (under the analysis tab look for import history). Also, when you hover over the graphic when logged into the website you can pick up the data points. There is also a table with the numerical data should you wish to look at just the numbers on a month by month basis.