Market Data
May 9, 2014
Currency Update for Steel Trading Nations- May 9th 2014
Written by Peter Wright
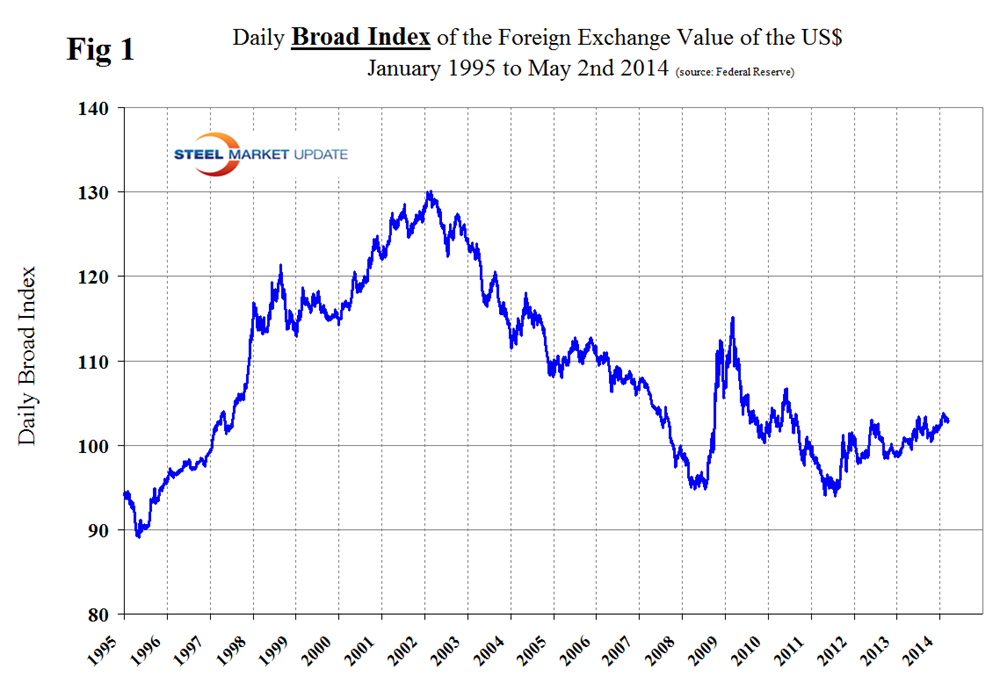
The Broad Index value of the US $ has been gradually strengthening for 18 months (Figure 1), which favors imports to the US and depresses exports. See explanation at the end of this piece.
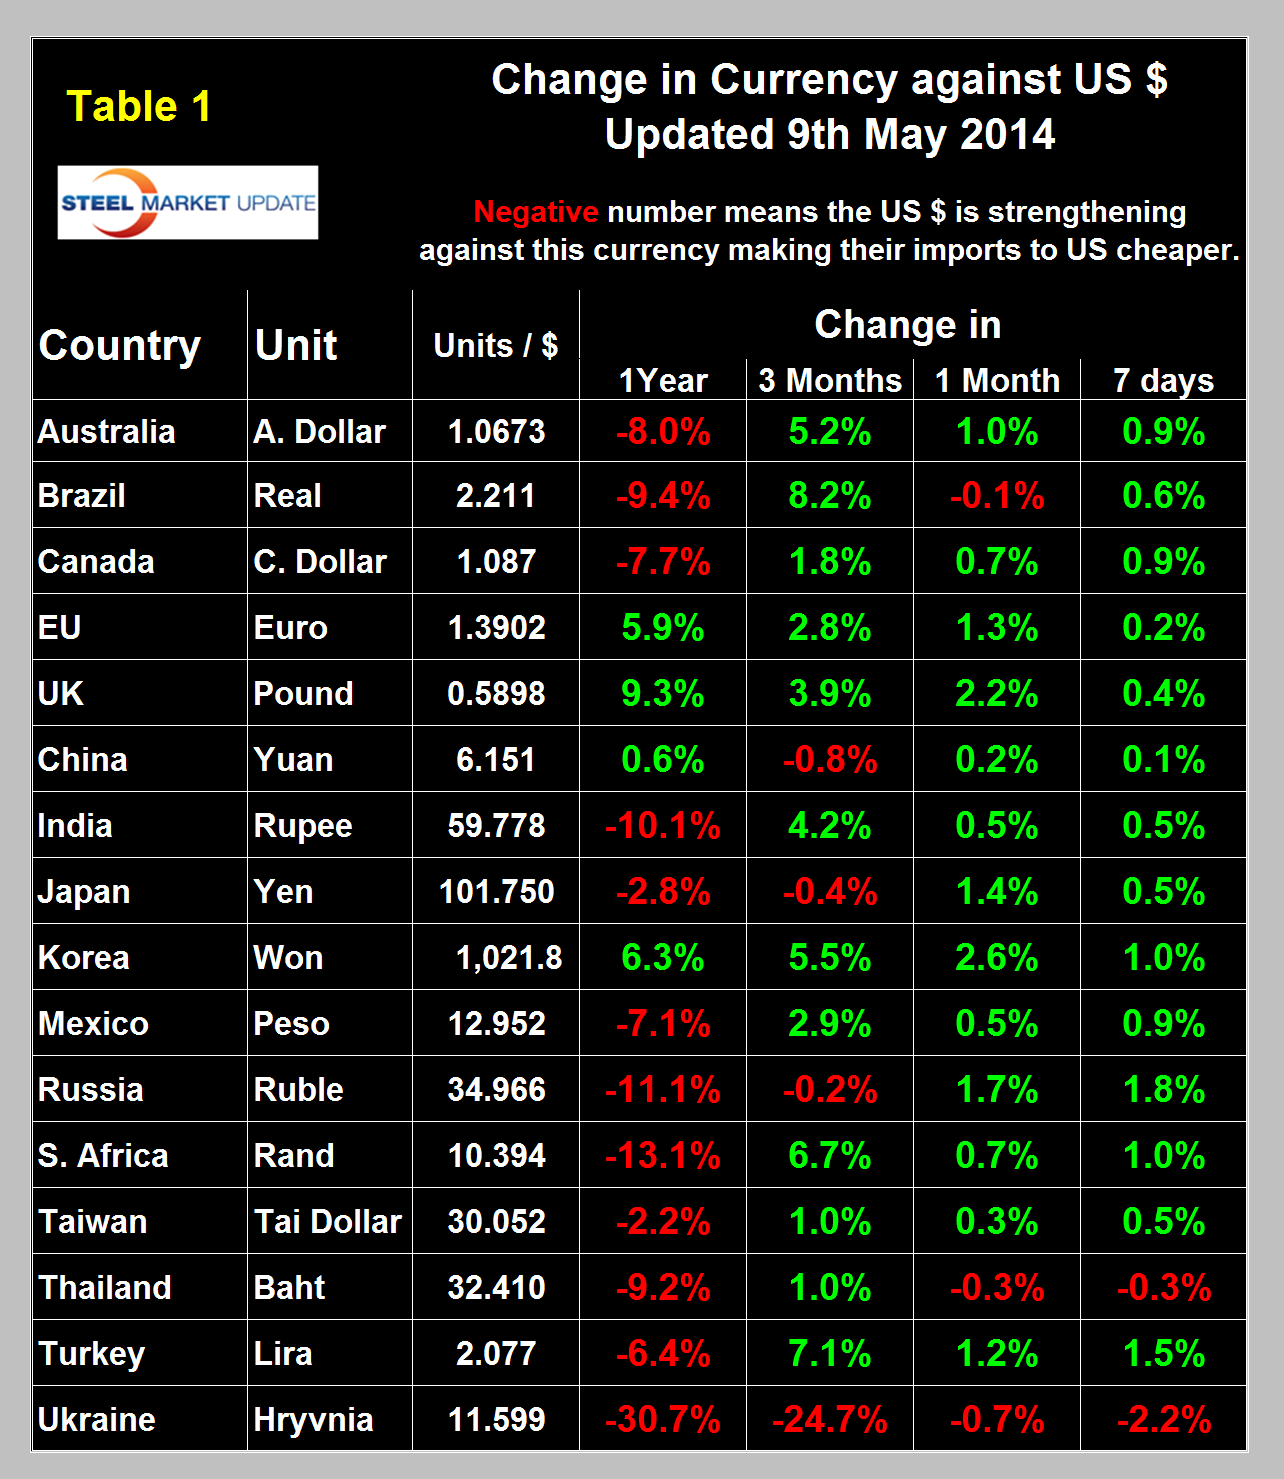
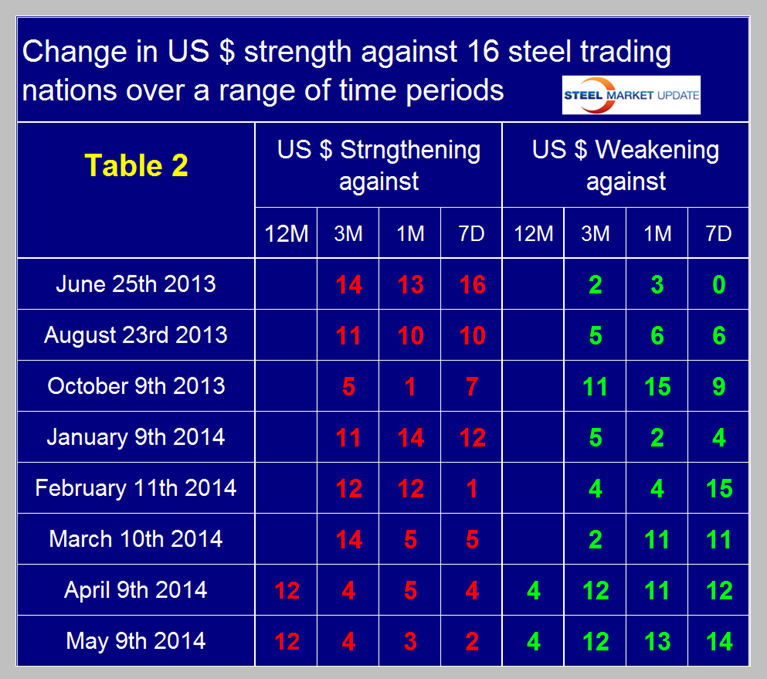
Table 1 shows the number of currency units that it takes to buy one US $ and the percent change in the last year, three months, one month and seven days. In the last year the US $ has strengthened against twelve of the currencies of the major sixteen steel trading nations. Table 1 is color coded to indicate strengthening in red and weakening in green. We regard strengthening as negative and weakening as positive because the effect on net imports. Since we did this analysis in March there has been a very significant swing towards a weaker dollar, (green) to the extent that in the last three months the US $ weakened against twelve of the sixteen steel trading currencies and in one month weakened against thirteen. This trend continued in the last seven days during which time the dollar weakened against fourteen of the steel trading currencies. At the present time the currencies of the steel trading nations are on balance moving in the opposite direction to the Broad Index. At SMU we regard this subject to be the most complicated and difficult to explain of anything we publish.
Table 2 attempts to clarify the overall change in the currency values of the sixteen steel trading nations and illustrates the points made above about direction over time.
In the last year the currencies of the major iron ore producing nations, Australia and Brazil have weakened against the US$ by 8.0 percent and 9.4 percent respectively. In the last three months all have experienced some strengthening which has continued into the early days of May. An increase in these currencies tends to support the global price of iron ore which is traded in US dollars.
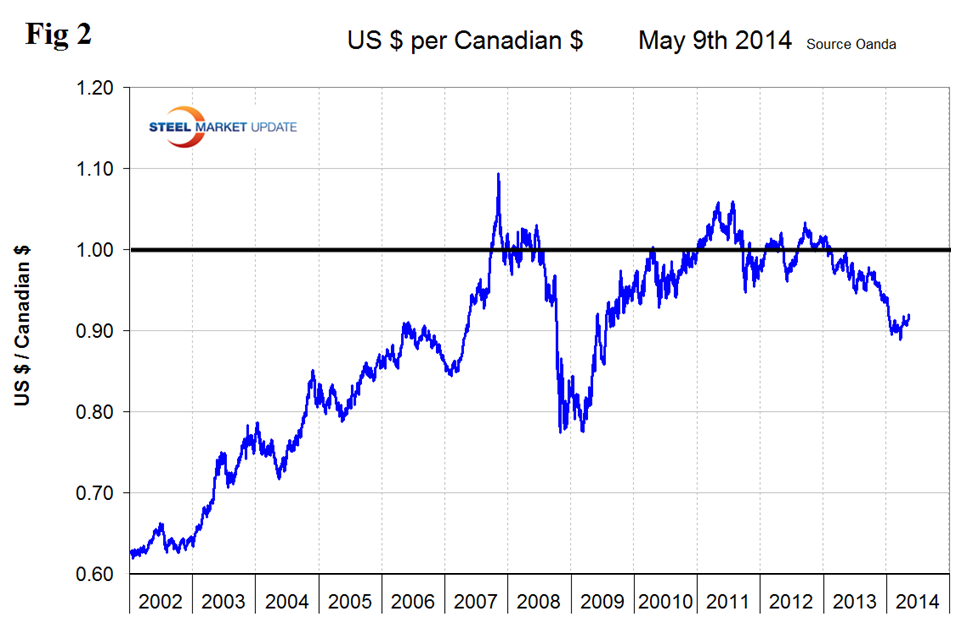
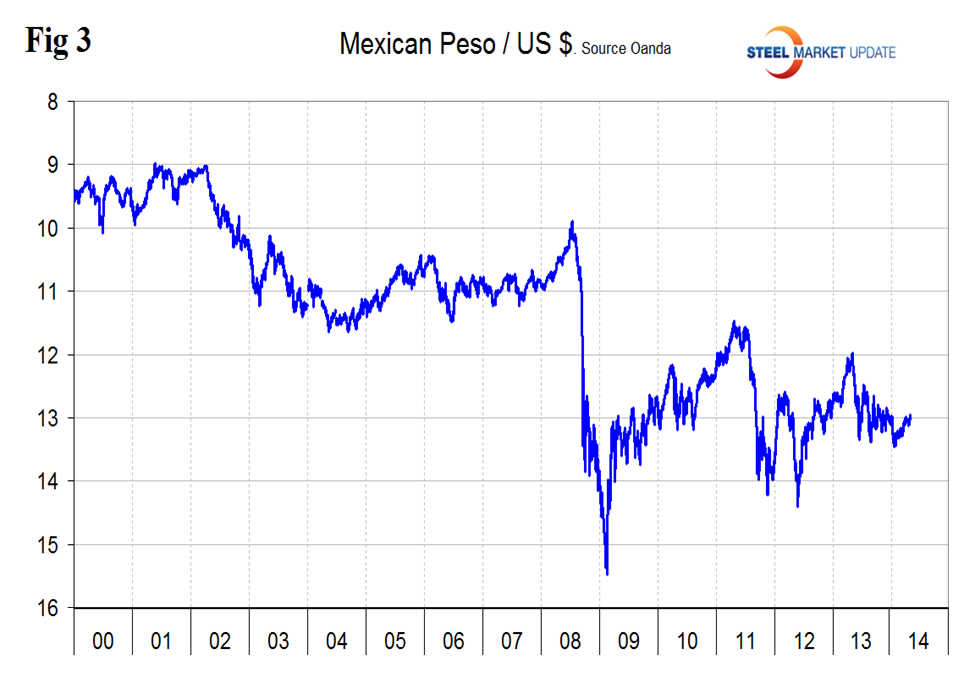
The Canadian $ and the Mexican Peso have both been strengthened against the dollar for most of 2014 and by similar amounts. This raises US competitiveness within NAFTA, (Figure 2 and Figure 3)
The Euro stood at 1.3902 on May 9th up from 1.3768 on April 9th. The Euro has as strengthened steadily for over 18 months and by 5.9 percent against the US $ in the last twelve months. There is talk of the European central Bank raising interest rates to stimulate inflation which will strengthen the Euro further. A strengthening Euro makes US scrap more attractive to Turkish buyers than alternative sources in Europe. At SMU we regard the Euro as unsustainable because of the wide disparity of unit manufacturing costs and labor productivity between Germany in particular and the nations in the south. The stronger the Euro the worse the effect on the uncompetitive nations which under free trading circumstances would simply de-value their currencies to correct trade imbalances. If, as we expect, the Euro ultimately comes unglued, the currencies of steel producing nations such as Italy and Spain will plummet with severe risk to the US steel industry.
The Chinese Yuan has strengthened by 0.2 percent in the last month after weakening by 0.8 percent in three months. We understand that the policy of strengthening the Yuan that existed since Q3 2010 has been abandoned and that the currency will float more freely in future.
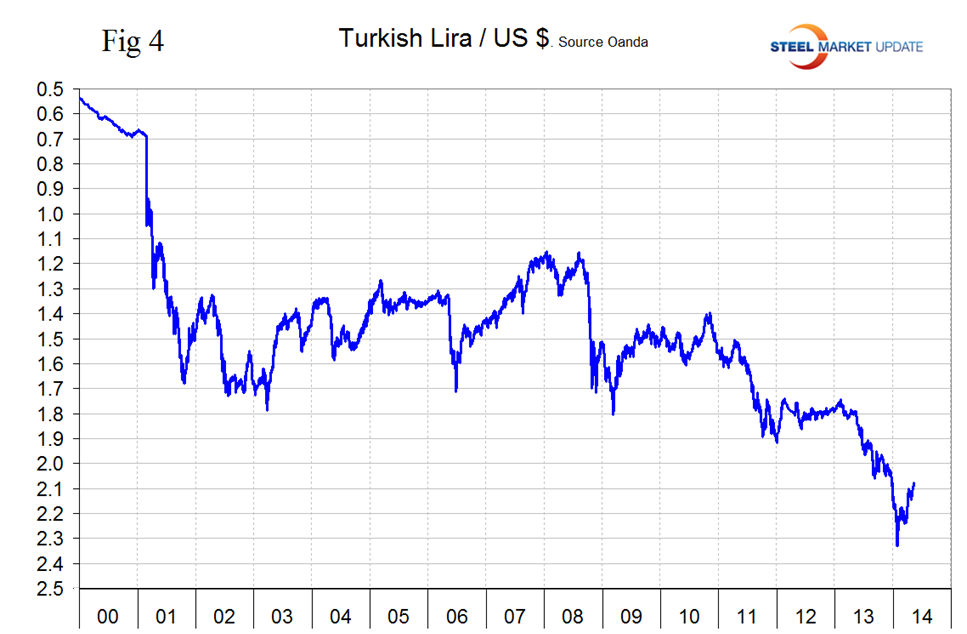
The Turkish Lira has recovered from its all-time low of 2.3299 / US $ on January 26th to 2.077 on May 9th, (Figure 4). What makes currency values counter intuitive and difficult to explain is that in the case of Turkey, for example, a lower number means the currency is stronger.
The Ukrainian Hryvnia is continuing its free fall, down by 24.7 percent in the last three months and 2.2 percent in the last seven days.
Explanation of data sources: The broad index is published by the Federal Reserve on both a daily and monthly basis. It is a weighted average of the foreign exchange values of the U.S. dollar against the currencies of a large group of major U.S. trading partners. The index weights, which change over time, are derived from U.S. export shares and from U.S. and foreign import shares. The data are noon buying rates in New York for cable transfers payable in the listed currencies. At SMU we use the historical exchange rates published in the Oanda Forex trading platform to track the currency value of the US $ against that of sixteen steel trading nations. Oanda operates within the guidelines of six major regulatory authorities around the world and provides access to over 70 currency pairs. Approximately $4 trillion US $ are traded every day on foreign exchange markets. Currencies of the steel trading nations as reported by Oanda do not necessarily track with the Federal Reserve Broad Index and, in fact, often move in the opposite direction.


