Prices

March 9, 2014
Final January Imports Exceed 3.2 Million Tons
Written by Brett Linton
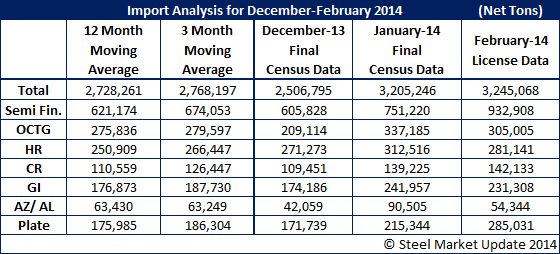
Total steel imports in January were 3,205,246 net tons (NT), the highest levels Steel Market Update has recorded since we began keeping track of monthly import data in mid-2009. January tonnage is a 27.9 percent increase over December figures and well above both the three month moving average (3MMA) and twelve month moving average (12MMA). In fact, January imports for semi-finished, OCTG, hot rolled, cold rolled, galvanized, Galvalume and plate products are above their respective 3MMA and 12MMA. Current February levels are projected to be 1.2 percent above those seen during January.

Semi-finished imports were 24 percent over December import levels, coming in at 751,220 NT. February levels are currently indicated to be even higher than January by 24.2 percent. In light of the current political situation involving Russia and the Ukraine, Russia was the largest exporting country for semi-finished products during the month of January with 295,877 tons. Brazil was snapping at Russia’s heels with 290,038 tons. A bit of a surprise for semi-finished was the United Kingdom (England) which prior to January a big month was 572 net tons (total). However, during January 2014 the UK managed to export 118,577 net tons of semi-finished products to the U.S.A.
Imports of Oil Country Tubular Goods (OCTG) were 337,185 NT, a 61.2 percent increase from December figures. The major exporting country was (by far) South Korea which shipped 155,259 net tons of OCTG to the U.S. during the month of January. To put that into perspective in December South Korea shipped 62,345 net tons. The next largest exporting country during January was Canada with 24,776 net tons and they remain in the same region for February. As we look at February OCTG imports appear they will be (in total) 9.5 percent lower than January.
Hot rolled (HR) steel imports increased 15.2 percent over December to 312,516 NT. The largest exporting countries included Canada, South Korea, Japan, Russia and Turkey. The Russia and Turkey shipments exceeded 36,000 net tons each and are significantly higher than prior months. February figures show HR imports down 10.0 percent over January levels. However, both South Korea and Russian exports of HR will be much higher than their January levels based on the February license data.
Many companies combine hot rolled and coiled plate imports together and we have been requested to do the same. Coiled plate imports were 151,773 net tons. The two largest suppliers are Canada and Russia with the Netherlands, Mexico and Brazil being notable exporters of coiled plate. When combined with hot rolled the total imports for the two products equal 464,289 net tons. This would then make it the second most popular product(s) to export to the U.S. behind semi-finished.
Imports of cold rolled (CR) steel were 139,225 MT in January, a 27.2 percent increase over the previous month. The largest exporting countries were Canada, South Korea, China and Mexico in that order. After being absent from the U.S. market for six months we welcome back Brazil which shipped 2,300 net tons and based on license data will be in excess of 5,000 tons in February and March. February estimates indicate CR imports will exceed January by 2.1 percent.
Galvanized (GI) imports were up 38.9 percent over December levels, resting at 241,957 MT for January. The top exporting countries are: Canada, India, China, South Korea, Mexico and Taiwan. Other countries of interest (shipping at least 5,000 net tons) are: Italy and France and we have to welcome back the UK with its 1,615 tons (England’s 12MMA prior to January was 64 net tons per month…). February levels are currently indicated to be 4.4 percent lower than January.
Other metallic coated (AZ/AL) imports, primarily Galvalume, jumped 115.2 percent over December levels to 90,505 MT. Exports of Galvalume are dominated by three countries: Taiwan, South Korea and Mexico. February figures show other metallic coated imports will be 39.9 percent lower than January levels.
Imports of plate (cut lengths and in coils) were 215,344 NT in January, up 25.4 percent over the previous month. Of the total, 63,570 tons were in cut lengths vs. coiled plate. The largest suppliers of cut length plate are Canada, Mexico and (surprise) South Korea. February estimates show plate imports (coiled and sheet) up 32.4 percent over January.
How Did SMU Do? Our Weekly Forecasts for January
Beginning with the month of January, Steel Market Update has begun forecasting monthly import levels based on the U.S. Department of Commerce license data. We begin the process of forecasting imports for the month beginning in the second week of the month and continue the process until the final Census Data is published. On Friday, March 7th the US DOC published the final numbers for January.
We convert the US DOC tonnages from metric tons into net tons (2,000 pounds) to make it easier for our readers to relate. As you can see by the table below the most accurate forecast was made on January 21st based on three weeks of data. The least reliable forecast was made in the final days of the month. Again, we use this exercise as a way of keeping track of trends (imports were increasing) but, we also want to point out how inaccurate license data alone can be.


