Market Data

January 29, 2014
Key Market Indicators January 28th 2014
Written by Peter Wright
An explanation of the Key Indicators concept is given at the end of this piece for those readers who are unfamiliar with it.
The total number of indicators considered by Steel Market Update at present is thirty six. The present situation of twelve of the indicators based on historical standards was positive on January 28th an increase of one from last month’s analysis, thirteen were negative, an increase of one and eleven considered to be neutral. The indicator that became positive in January was the Chicago Fed National Economic Index which currently has economic performance above the long term trend. The capacity utilization of the long product mills was moved from neutral to negative as its value declined to 76.1 percent. This continues to be one of the best results since this analysis was first published in March when seven indicators were positive by historical standards and fourteen were negative.
The present situation of the general economy is pretty much in a holding pattern with four indicators in neutral, three positive and one negative. Consumer confidence released today by the Conference Board improved nicely bit still has a long way to go to recover from its pre-recession level. The SMU buyer’s index and continues to be positive and the SMU service center excess is neutral with only 2,000 tons of excess in the most recent analysis. Present situation indicators for long and flat steel products are similar with shipments at both the mill and service levels being low by historical standards. The only difference between the long and flat sectors is that net imports of long products are historically high and of flat products are neutral. All the construction indicators except the producer price index of commodities are negative at present. All the manufacturing indicators are either positive or neutral.
The quantitative analysis of the value of each indicator over time is shown in the “Trend” column. At present twenty four trends are moving in the right direction. Since the December analysis a net of one indicator has changed from positive to negative and two have changed to the negative direction. Trends in the general economy were unchanged with four positives and four negatives. We expect this ratio to move towards positive in 2014 based on recent economic data. The SMU steel buyer’s sentiment index improved by 2 points and the apparent excess increased by 60,000 tons from a 59,000 ton deficit to a 2,000 ton surplus. The only negative trends in the steel long products sector were declines in capacity utilization from December and in daily service center shipments on a three month moving average basis year over year. There were three negative trends in the flat rolled sector. Mill shipments, year over year and capacity utilization month over month declined and the iron ore 62 percent Platts Index index had declined by a further $18 on January 24th. Shipments increased from service centers on a year over year basis and net imports decreased on a month over month basis. All the construction indicators except the producer price index of commodities are improving. All the manufacturing indicators are improving except the ISM Index which on a 3MMA basis fell by .09 percent to 56.0 which is still a very satisfactory level.
The key indicators analysis confirms our experience that the current market is not great but tells us that most trends which are quantified are moving in the right direction and there is positive momentum. The trends specific to the steel market are being positively driven by the manufacturing sector and negatively by construction. SMU has several benchmark analyses that show steel demand to be below the historical norm for this stage of a recovery. This is because the depression in non residential and housing construction was so extreme that it will be years before the pre-recessionary levels are reached. In addition government funded infrastructure work is still depressed.
We believe a continued examination of both the present situation and direction will be a valuable tool for corporate business planning.
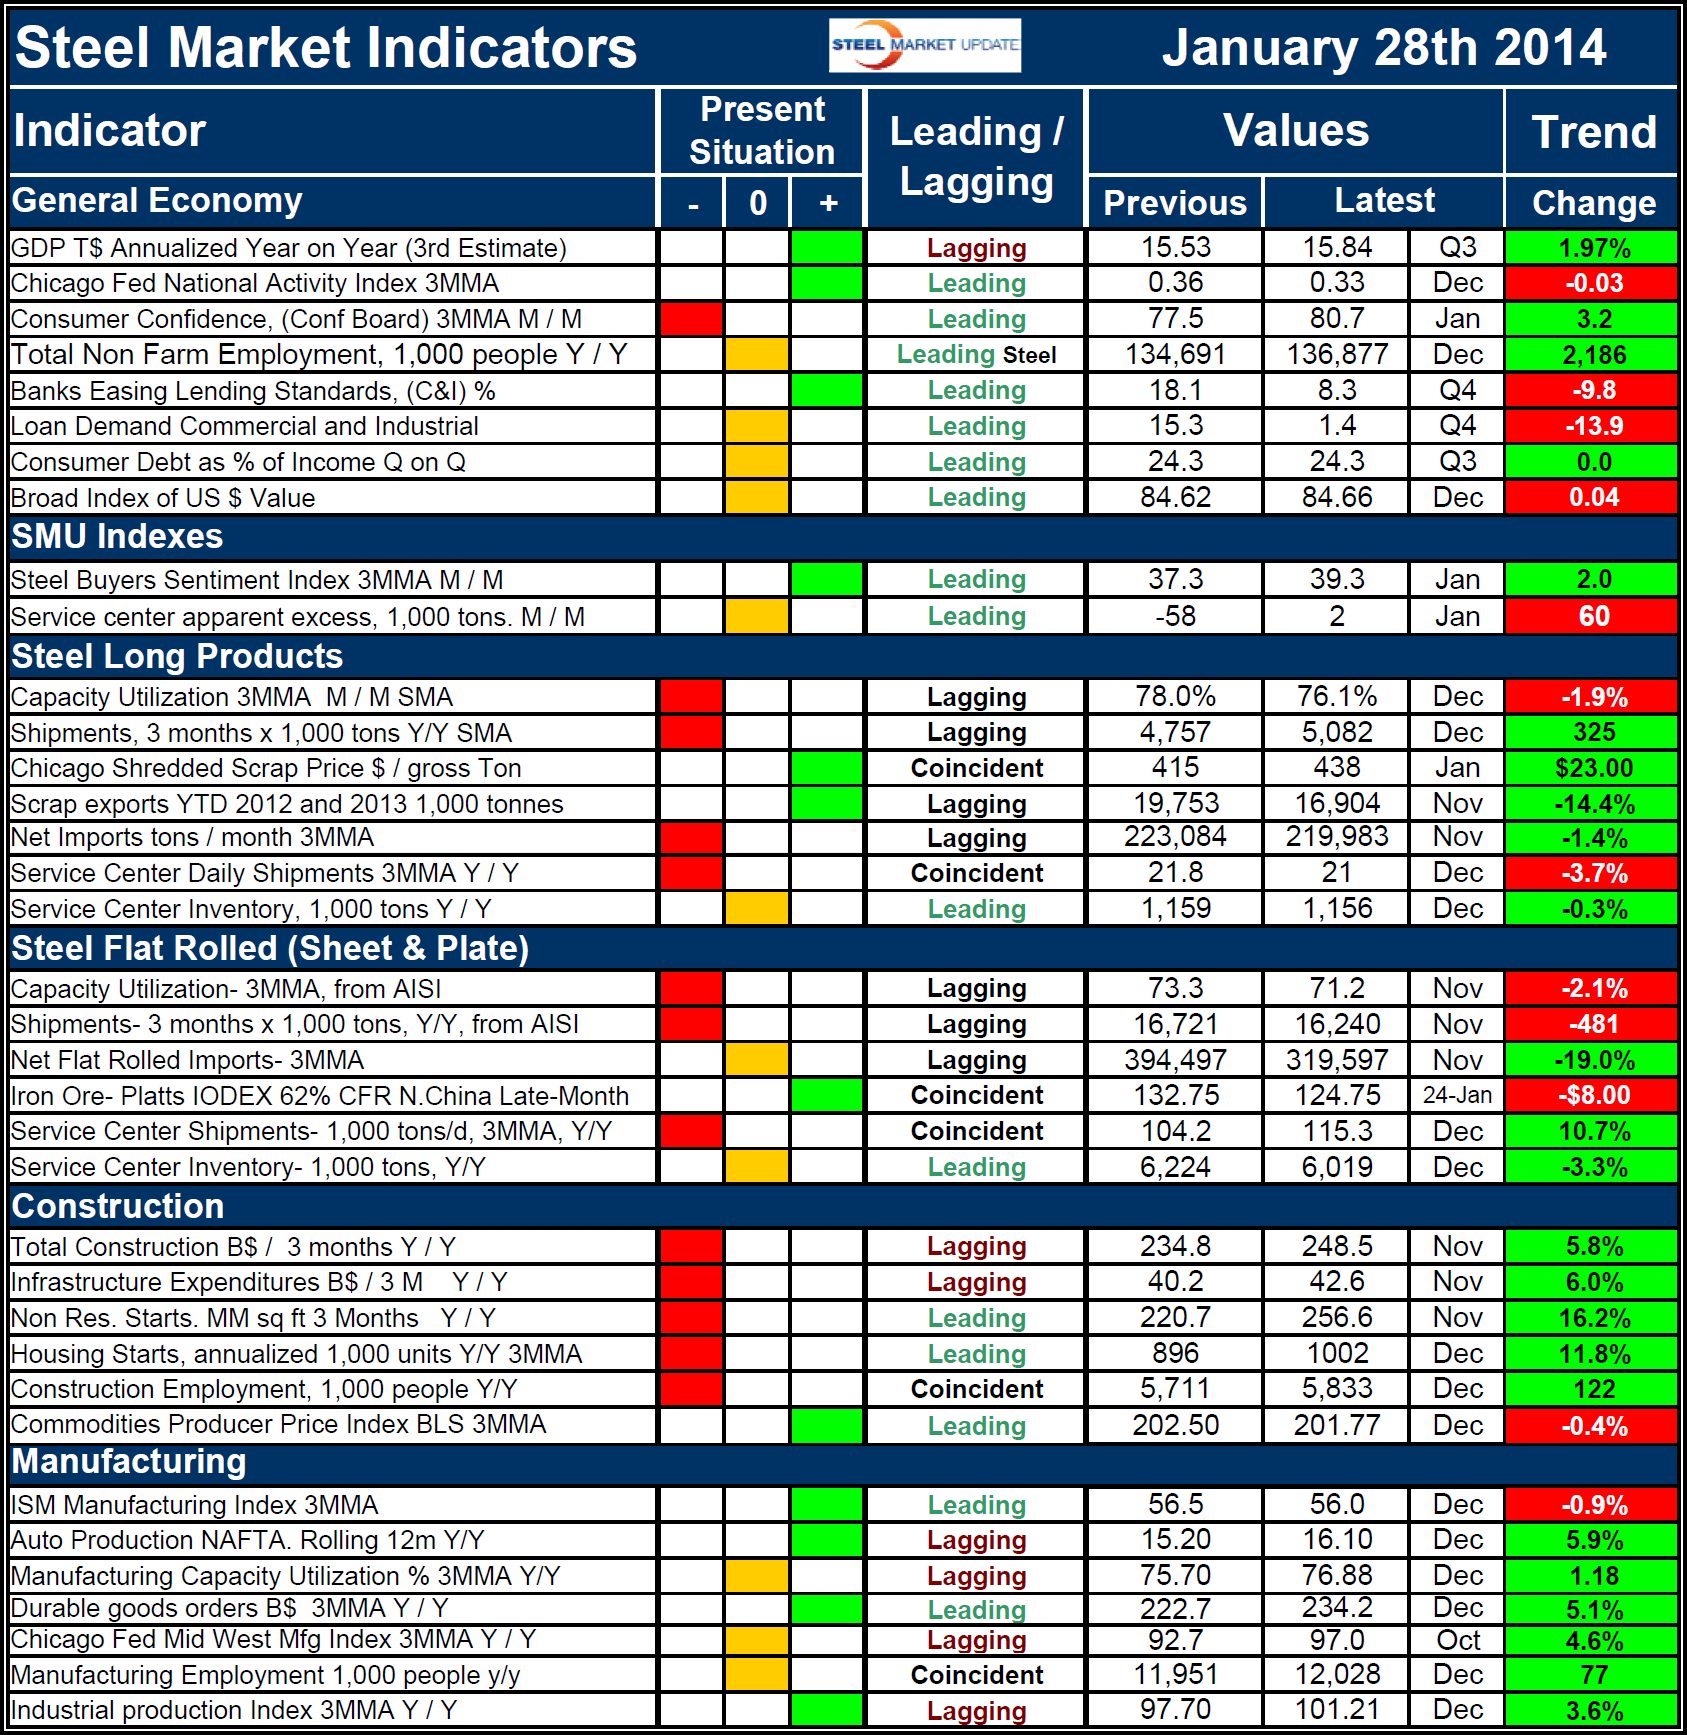
Explanation: The key indicators chart is designed to give a snapshot of the steel market on a specific date. The chart is stacked vertically to separate the primary indicators of the general economy, of proprietary Steel Market Update indices, of both flat rolled and long product market indicators and finally of construction and manufacturing indicators. The indicators are classified as leading, coincident or lagging as indicated.
Columns in the chart are designed to differentiate between the current situation and the direction in which the market is headed. The present situation is sub-divided into, below the historical norm (-), (OK), and above the historical norm (+). The “Values” section of the chart is a quantitative definition of the market’s direction. In cases where seasonality is an issue, the evaluation of market direction is made on a three month moving average basis and compared year over year to eliminate this effect. Where seasonality is not an issue concurrent periods are compared. The date of the latest data is identified in the third values column. Values will always be current as of the date of publication. Finally the far right column quantifies the trend as a percentage or numerical change with color code classification to indicate positive or negative direction.