

Market Data

November 22, 2013
SMU Key Market Indicators
Written by Peter Wright
The total number of Key Market Indicators considered at present is thirty six. The present situation of eleven of the indicators based on historical standards was positive on November 21st the same as on October 31st but there were two changes.
We changed the situation of demand for commercial and industrial bank loans from green to amber because only a net 1.4 percent of banks reported a net demand increase in the 3rd quarter. And we changed the present situation of GDP from amber to green since the value of goods and services in the US is now higher than the pre-recessionary level.
This continues to be the best result since this analysis was first published in March when seven indicators were positive by historical standards and fourteen were negative. The present situation of the general economy is pretty much in a holding pattern with five indicators in neutral, two positive and one negative.
The SMU buyer’s index and the SMU service center excess statistics are both currently positive by historical standards. Present situation indicators for long and flat steel products are similar except that net imports of long products are high and of flat rolled are normal. All the construction indicators except the producer price index of commodities are negative at present. All the manufacturing indicators are either positive or neutral.
The quantitative analysis of the value of each indicator over time is shown in the “Trend” column. At present trends are moving in the right direction. Twenty seven of thirty six indicators are improving however this is a decrease of three since October 31st. Four of eight indicators of the general economy are headed in the right direction a decline of two from our last report. Loan demand trended negative and the value of the US $ strengthened which we regard as a negative trend from a steel trade point of view.
The Steel Market Update buyer’s sentiment deteriorated from the previous report and the apparent service center deficit declined from 382,000 tons to 361,000 tons still indicating pent up demand that will have to be released sooner or later. Net imports of long products deteriorated but shipments changed to a positive trend. The only change for flat rolled was that the price of iron ore strengthened.
All the construction indicators except the producer price index of commodities are improving as are all of the manufacturing indicators.
The key indicators analysis confirms our experience that the current market is not great but tells us that most trends which are quantified are moving in the right direction and there is positive momentum. The trends specific to the steel market are believed to be negatively affected by political uncertainty and not to be representative of true demand at the end market level. We believe a continued examination of both the present situation and direction will be a valuable tool for corporate business planning.
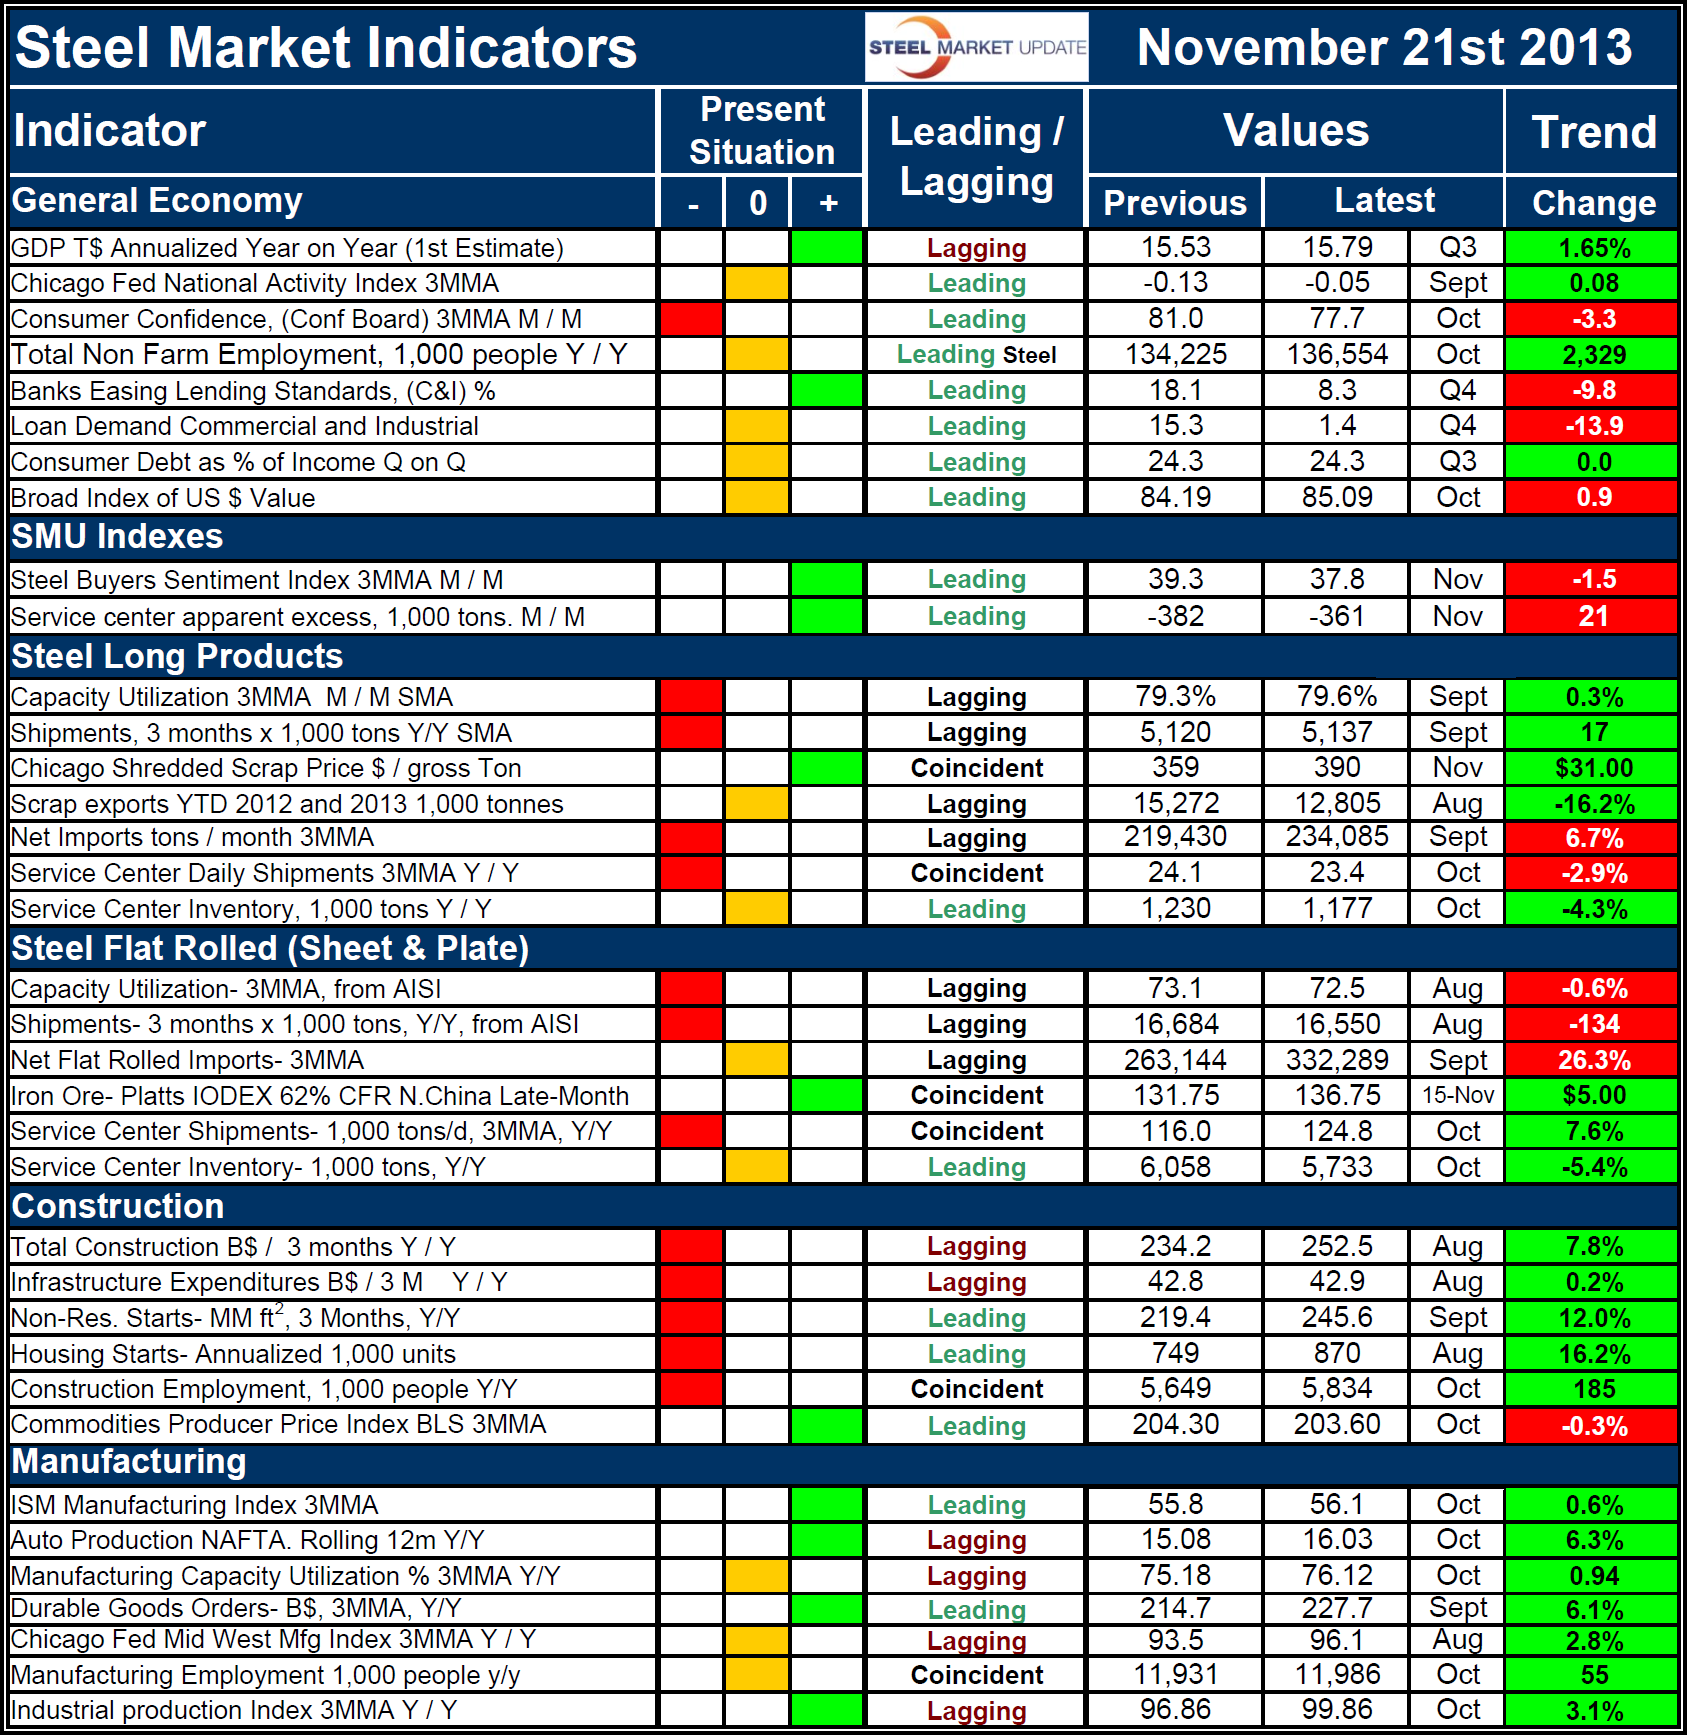
Explanation: The key indicators chart is designed to give a snapshot of the steel market on a specific date. The chart is stacked vertically to separate the primary indicators of the general economy, of proprietary Steel Market Update indices, of both flat rolled and long product market indicators and finally of construction and manufacturing indicators. The indicators are classified as leading, coincident or lagging as indicated.
Columns in the chart are designed to differentiate between the current situation and the direction in which the market is headed. The present situation is sub-divided into, below the historical norm (-), (OK), and above the historical norm (+). The “Values” section of the chart is a quantitative definition of the market’s direction. In cases where seasonality is an issue, the evaluation of market direction is made on a three month moving average basis and compared year over year to eliminate this effect. Where seasonality is not an issue concurrent periods are compared. The date of the latest data is identified in the third values column. Values will always be current as of the date of publication. Finally the far right column quantifies the trend as a percentage or numerical change with color code classification to indicate positive or negative direction.


