

Prices

March 20, 2025
HR Futures: Market drifts lower on light volume
Written by David Feldstein
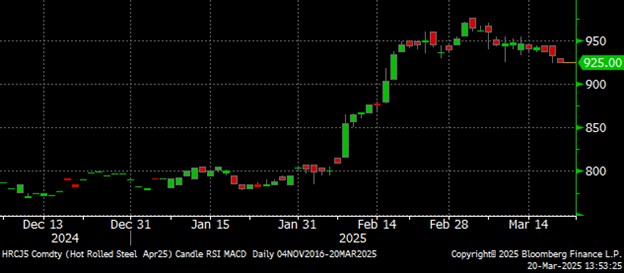
Over the past couple of weeks, Midwest HRC futures have been drifting lower on light volume. This begs the question if the rally has run out of steam, or is it catching its breath after ripping roughly $150 in less than two weeks? The April CME Midwest HRC future made an intraday high at $976 on March 5, and has since given back $50, settling today at $925.
April CME HRC future $/st
The Midwest HRC futures curve was about flat on Friday, Feb. 7, the weekend of not only the Super Bowl, but also the super surprise of 25% blanket tariffs for steel and aluminum imports. Up, up and away the futures curve went soaring into the mid-$950s. However, back, back, back the curve came with the 2nd half now little changed, up a paltry $20 to as little as nil.
Shortly after Trump was elected in November, he announced his plans to tariff Mexican and Canadian imports 25% (currently in reprieve mode). Not only did the futures curve not respond with a rally, it actually declined into year-end. On Inauguration Day, Trump reiterated his plans for 25% tariffs, but still there was little reaction. Finally the market moved in response to Trump’s surprise steel tariff announcement on Super Bowl Sunday.
CME hot-rolled coil futures curve $/st
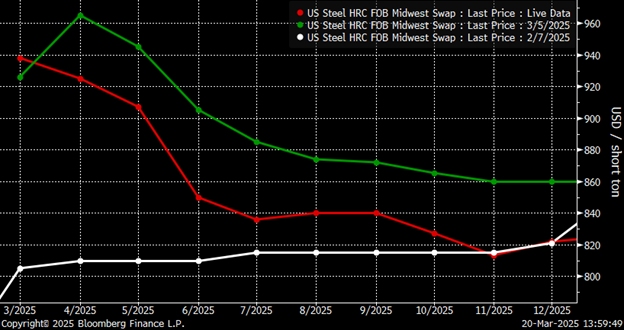
While the front end of the curve ripped higher, there appeared to have been little response to the tariff announcement via the long duration futures channel both. This is evidenced by a sharp drop-off in open interest after the July future.
The industry seems to be both in chaos, having shockingly been caught flat-footed despite Trump’s consistent communications, and complacency as the uncertainty appears to have resulted in ostrich-like head-burying behavior. Perhaps the end-users are simply focused on the here and now, but as we approach the start of Q2 in less than two weeks, will we see another surge of buying as said buyers’ attention rolls into Q3?
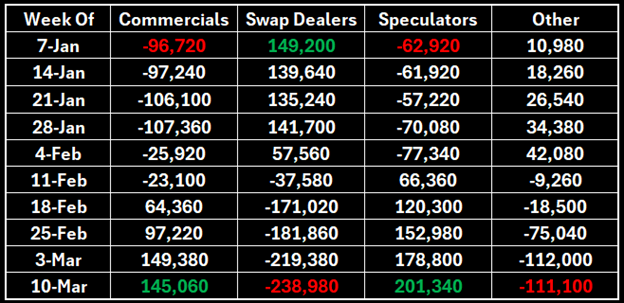
The Commodities Futures Trading Commission (CFTC) categorizes futures market participants into four categories: commercials (physical), managed money (speculators), swap dealers (banks), and other (imports). Each Friday, the CFTC publishes a breakdown of open interest as of Tuesday’s close, detailing the long and short positions held in aggregate by each participant group.
This table summarizes the CFTC’s Commitment of Traders report, specifically showing the net futures position (long minus short) for each of the four categories of traders. Notice the change in the net position of each group from Jan. 7 through March 10. Especially take a look at the swap dealers that went from net long ~150,000 tons to net short ~240,000 tons. As buyers flooded into the market, the liquidity providing swap dealers were surely run over. Swap dealers likely scrambled to offset the buying imbalance where they could, but there is no doubt their P&L is deep in the red.
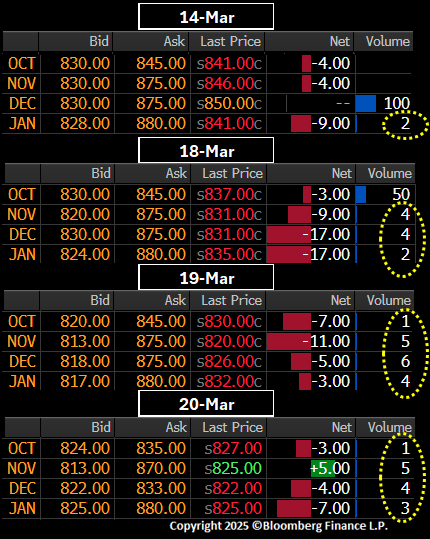
An interesting thing happened on the way to the market close. If you are like me and start looking at the HRC market around dinnertime on Sunday night, and then again before bed, and then again first thing in the morning, you might have noticed the back months, especially Q4, would be down $5-$15 with only 1 or 2 lots being traded.
As you will see below, there has been a methodical selling on tiny volume on a day-to-day basis going back to at least last Friday. The most obvious motive in moving these back months lower is to improve the P&L in those back months perhaps offsetting the significant losses in the front months. Since there is no forward buying interest in these back months, they are extremely illiquid and a trader can easily accomplish this with a few hundred tons. At the same time, if forward buying suddenly returns, the illiquidity in these months could result in a sharp move back up. Look at the size of the bid-ask spread!
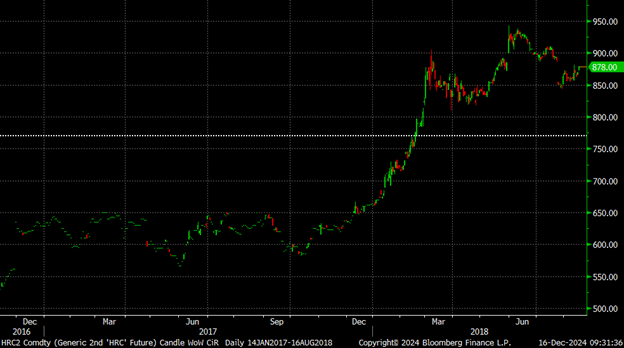
This is the chart of the rolling 2nd month CME Midwest HRC future from the end of 2016 through August 2018. From the start of 2018 until March 7, the future shot up from $665 to $900, or 35%. The market spent the next two months consolidating and drifting lower before catching a second wind from a low of $818 to a high of $943 on May 31.
Rolling 2nd month CME HRC future $/st 2017-18
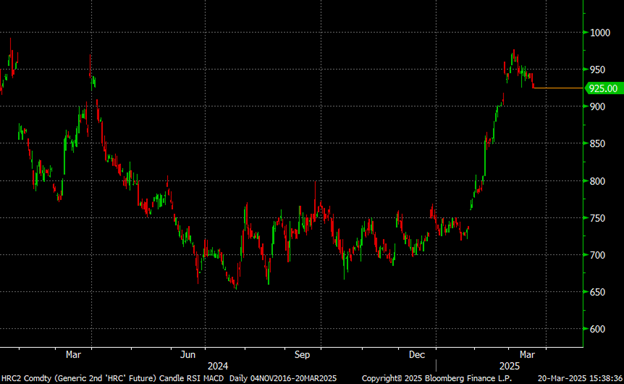
The 2nd month HRC future ended 2024 at $743, rallied 31.4% to a high of $976 on March 5 (just two days before the seventh anniversary of the initial high noted above) and has since drifted lower. It would seem history is destined to repeat itself, but which history will it be? Will history repeat itself with a second wave to a Trump-tariff induced rally as it did in 2018, or will we see another two-month roundtrip as has occurred a few times over the past few years?
Rolling 2nd month CME HRC Future $/st 2017-18
Disclaimer
The content of this article is for informational purposes only. The views in this article do not represent financial services or advice. Any opinion expressed by Mr. Feldstein should not be treated as a specific inducement to make a particular investment or follow a particular strategy, but only as an expression of his opinion. Views and forecasts expressed are as of date indicated, are subject to change without notice, may not come to be and do not represent a recommendation or offer of any particular security, strategy or investment. Strategies mentioned may not be suitable for you. You must make an independent decision regarding investments or strategies mentioned in this article. It is recommended you consider your own particular circumstances and seek the advice from a financial professional before taking action in financial markets.


