Analysis
February 14, 2025
February energy market update
Written by Brett Linton
Editor’s note: Steel Market Update is pleased to share this Premium content with Executive members. For information on how to upgrade to a Premium-level subscription, contact Luis Corona at luis.corona@crugroup.com.
In this Premium analysis we examine North American oil and natural gas prices, drill rig activity, and crude oil stock levels. Trends in energy prices and rig counts serve as leading indicators for oil country tubular goods (OCTG) and line pipe demand.
The Energy Information Administration (EIA) published its February Short-Term Energy Outlook (STEO) this week. The report projects that crude oil prices will remain stable throughout 2025 before gradually declining in 2026 as rising production exceeds demand. Meanwhile, natural gas prices are forecast to rise into 2026, driven by demand outpacing production growth. Click here to read the full February STEO report covering energy spot prices, production, inventories, and more.
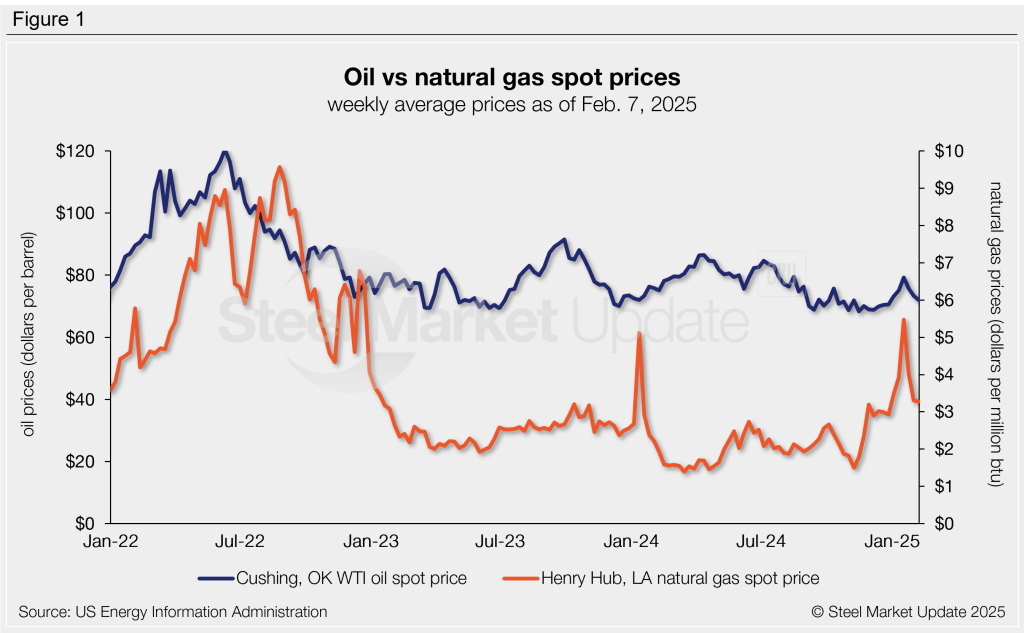
Oil spot prices
The weekly West Texas Intermediate oil spot market price has edged lower in the last four weeks, but remains in the $70-90 per barrel (b) range generally observed in the last two-plus years. After rising to a five-month high of $79.28/b in mid-January, spot prices have since trended lower, easing to $72.05/b as of Feb. 7 (Figure 1). Compare this to the near three-year low spot price of $68.38/b seen last November.
The February STEO forecasts oil spot prices to average $74/b across 2025 and $66/b in 2026, both unchanged from the January forecast.
Gas spot prices
Following multi-decade lows seen earlier in 2024, natural gas spot prices surged from November through January due to increased winter heating consumption. In mid-January, prices briefly touched a two-year high of $5.47/mmBtu. The latest natural gas spot price has receded to $3.28/mmBtu as of Feb. 7.
The EIA forecasts natural gas prices to rise throughout the year, forecasting 2024 prices to average $3.80/mmBtu, an upwards revision from their previous forecast of $3.10/mmBtu. Estimates for 2026 have also been revised higher, rising from $4.00/mmBtu last month to $4.20/mmBtu in the latest report.
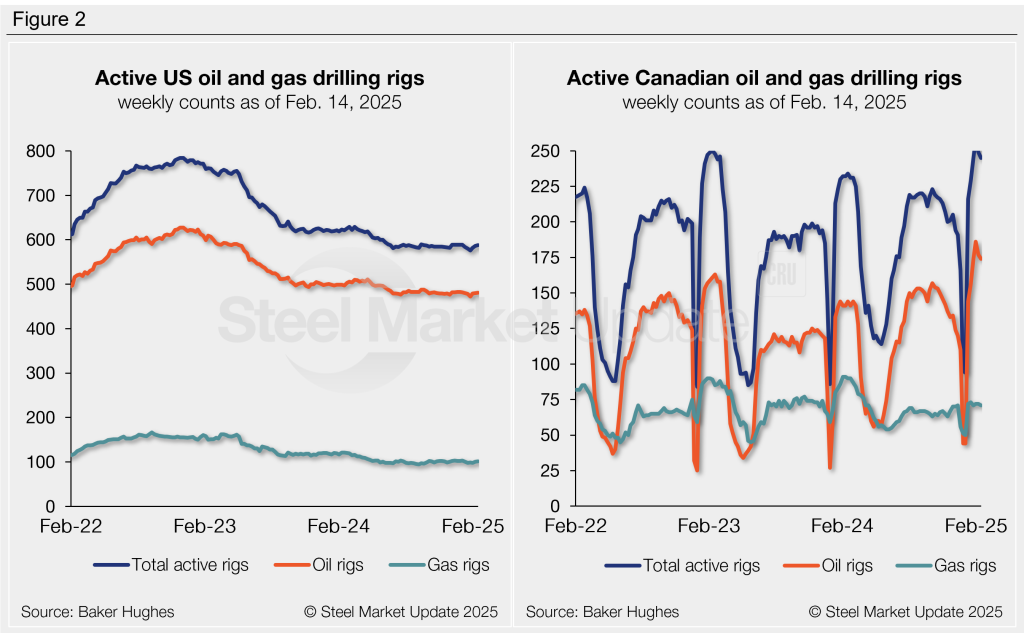
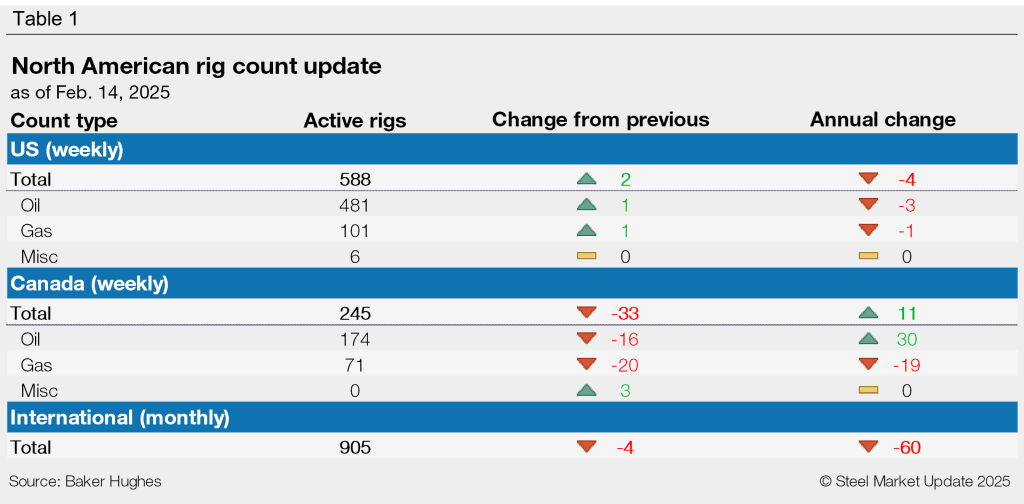
Rig counts
US drilling activity has remained at reduced levels since June 2024, as evident in the left graph of Figure 2. According to Baker Hughes, the latest US count is 588 active rigs as of Feb. 14. Compare this to the two-and-a-half-year low witnessed back in June 2024 of 581 rigs.
The latest active Canadian rig count eased to 245 rigs as of Feb. 14 (Figure 2, right). This decline comes just two weeks after counts reached a near seven-year high. Canadian rig activity typically soars through February, then declines through May as warmer weather and thawing ground conditions limit access to roads and drill sites.
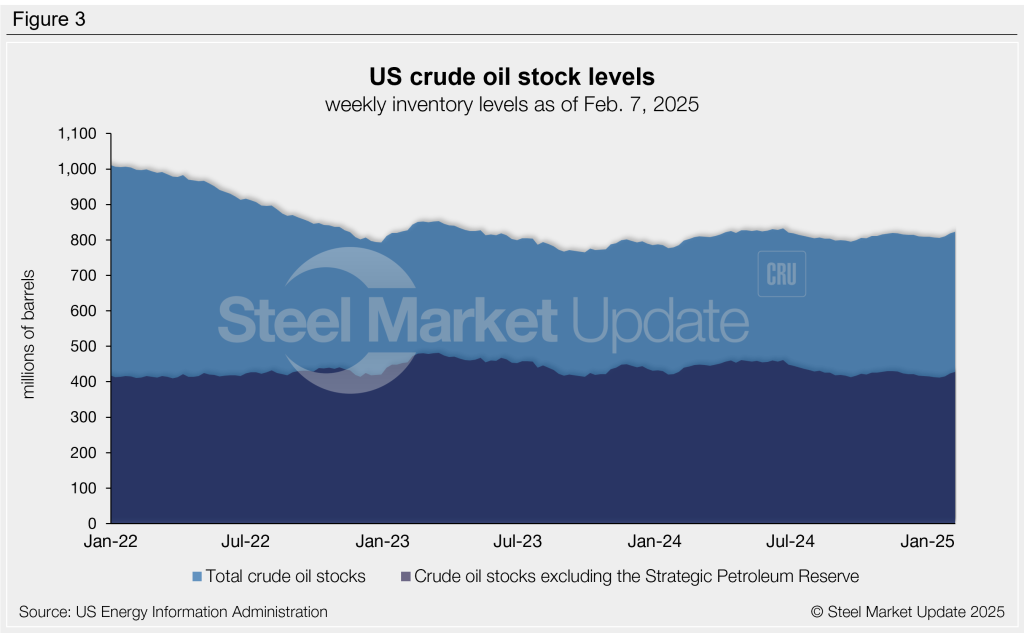
Crude stock levels
US crude oil stock levels have been relatively stable for the last two years. The latest stock level has increased to a seven-month high 823 million barrels as of Feb. 7. Stock levels are 3% higher than this time one year ago, but 2% lower than they were in February 2023 (Figure 3).