Prices
January 24, 2025
HR Futures: Market coiled and ready to move in 2025?
Written by Daniel Doderer & Sean Kessler
The last six months have been littered with uncertainty and mixed signals, a choppy and rangebound market. Spot indices have largely held steady, despite the pressure from domestic mills pushing for higher prices on spot tons. This has provided a signal of a lack of upward momentum and little downside room based on mill costs. The dynamics further pushing and pulling the futures market are driven by speculation around what the mix of tariffs will look like, from the new administration as well as the AD/CVD determinations.
One of the key features of the current market environment is the steep contango in the forward curve. This stretches through May 2025 before flattening for the remainder of the year. Notably, this is one of the more extended periods of contango. In fact, we would have to go back to 2016 for the last time the market has been in contango for more than 41 consecutive weeks.
The chart below shows the futures curve on Friday (white), in the beginning of May 2024 (shortly after this contango market structure began, purple), in July 2024 (when the front of the curve traded at its lowest level, orange), and at the end of December (one month ago, a far “flatter” curve, blue).
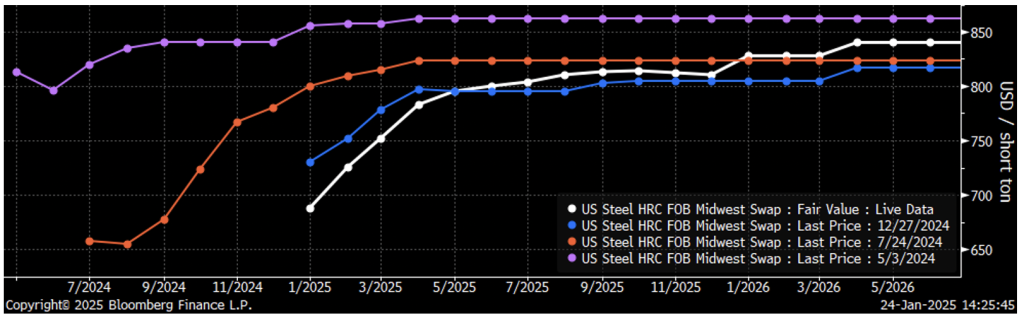
As a reminder, a contango market structure typically suggests the physical market is well-supplied. As future prices are higher than spot prices, this indicates an oversupply in the current market, along with the expectation that supply will remain ample in the coming months. However, what may be different in this contango is the embedded expectation that trade cases and tariffs will make future prices higher, regardless of supply/demand dynamics.
Another key observation is the resistance that the February futures contract encountered near the $750-per-short-ton (st) mark over the last two months (below).
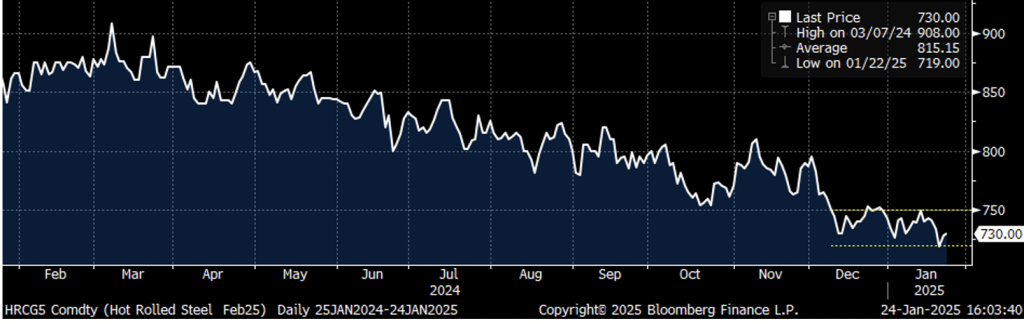
This price point has coincided with Nucor’s advertised consumer spot price (CSP), indicating that producers are likely targeting this level for pricing. The repeated testing of this level suggests that the worse-than-anticipated demand in the physical market stands in the way of trader’s confidence in mills getting their asking price in the next couple weeks. At the same time, the support at $720 indicates there is a solid floor beneath prices, with buying interest likely being sufficient to prevent a sharp drop. These price levels highlight the tug-of-war between mill pricing strategies and market demand. And both sides are looking for favorable conditions to make their moves.
Looking at the second quarter, futures trading activity has picked up significantly, with contracts hovering near $800 per st over the last three weeks (Friday = white, 1 week = blue, 2 weeks = orange, below).
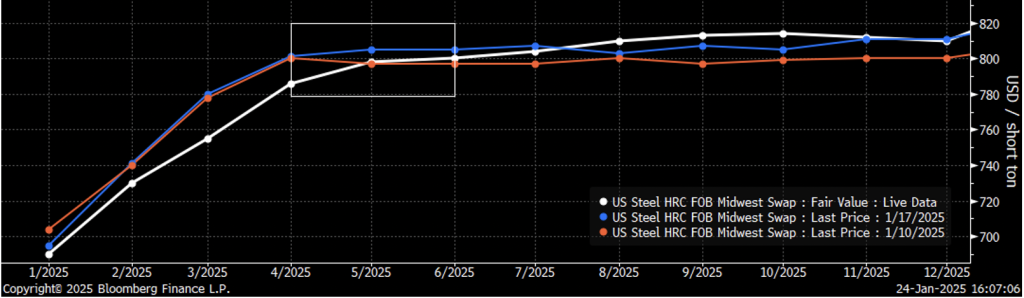
This indicates a sustained sense of optimism that this could be a pivot point for demand and trade action impact, even under the knowledge that tariffs were not a Day 1 agenda item.
The fact that aggregate open interest across all contracts (below) reached a multi-year high in December is another important signal.
Open interest is a key indicator of market participation, and the surge in open interest to levels not seen since March 2022 suggests that there is an increased amount of liquidity and health in the market. This could be driven by both hedge funds and commercial participants looking to take advantage of perceived mispricing or potential market movements.
In conclusion, while the market has recently been surprisingly rangebound, underlying dynamics highlight the fact that the market is coiled as we navigate the current period of mixed demand signals and policy uncertainty. While the futures market remains in contango, suggesting a well-supplied physical market, the strong resistance at $750 and support at $720 point to ongoing tensions between market participants. The stability in Q2 and beyond for futures trading and the rise in open interest suggest a growing sense of anticipation for what lies ahead – this is bound to be a fascinating year.
Disclaimer: The content of this article is for informational purposes only. The views in this article do not represent financial services or advice. Any opinion expressed by Flack Global Metals or Flack Capital Markets should not be treated as a specific inducement to make a particular investment or follow a particular strategy, but only as an expression of his opinion. Views and forecasts expressed are as of date indicated, are subject to change without notice, may not come to be and do not represent a recommendation or offer of any particular security, strategy or investment. Strategies mentioned may not be suitable for you. You must make an independent decision regarding investments or strategies mentioned in this article. It is recommended you consider your own particular circumstances and seek the advice from a financial professional before taking action in financial markets.