Market Data
December 13, 2024
December energy market update
Written by Brett Linton
Editor’s note: Steel Market Update is pleased to share this Premium content with Executive members. For information on how to upgrade to a Premium-level subscription, contact Luis Corona at luis.corona@crugroup.com.
In this Premium analysis, we cover North American oil and natural gas prices, drilling rig activity, and crude oil stock levels. Trends in energy prices and active rig counts are leading demand indicators for oil country tubular goods (OCTG), line pipe, and other steel products.
The Energy Information Administration (EIA) released their December Short-Term Energy Outlook (STEO) earlier this week. Their latest forecast predicts crude oil prices will remain stable throughout 2025, while natural gas prices are expected to rise for the remainder of the winter heating season. Click here to read the full December STEO report covering energy spot prices, production, inventories, and more.
Oil spot prices
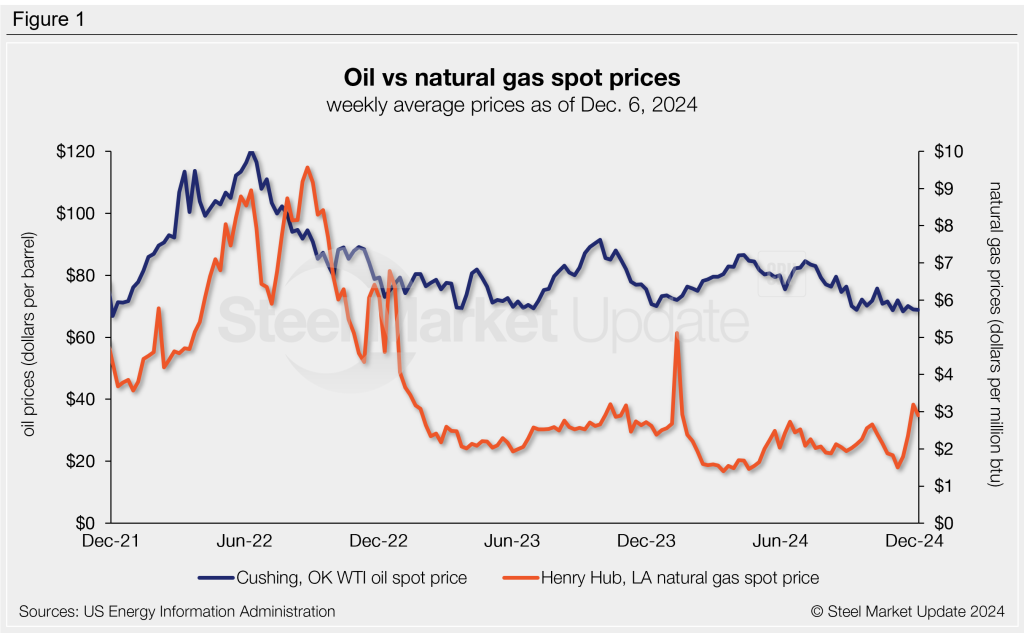
The weekly West Texas Intermediate oil spot market price has trended lower in recent months after bobbing within the $70-90 per barrel range for the prior two years. Spot prices recently fell to a near three-year low of $68.38/b in mid-November. The latest spot price is $68.89 as of Dec. 6 (Figure 1).
The December STEO forecasts oil spot prices to average $74/b across 2025 on expectations of a relatively balanced oil market.
Gas spot prices
Following multi-decade lows seen earlier this year, natural gas spot prices have fluctuated in recent months and began to rise in mid-November. The latest natural gas spot price is $2.90/mmBtu as of Dec. 6. One week prior to this, prices reached the highest weekly rate seen in almost a year ($3.19/mmBtu).
The EIA forecasts natural gas prices to rise in the coming months, following regular seasonal patterns. They forecast prices to average $3.00/mmBtu for the remainder of the winter, up from November’s average of $2.00/mmBtu.
Rig counts
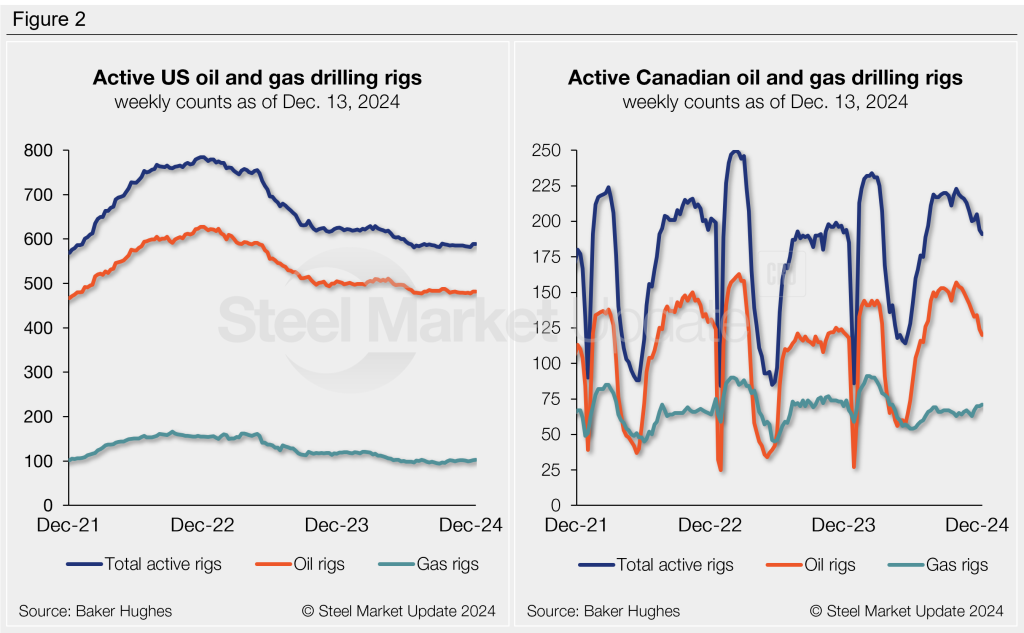
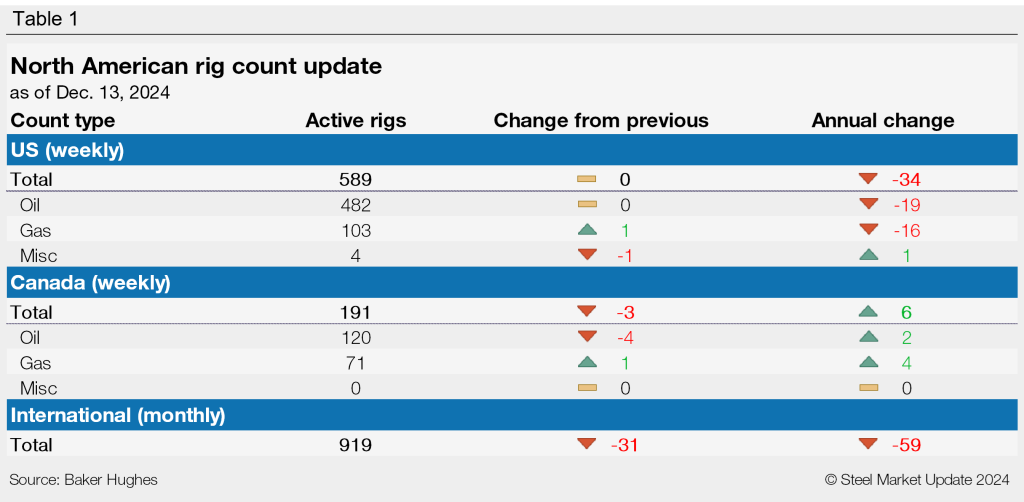
The number of active US drilling rigs in operation remains near multi-year lows, as has been the case since June. The latest US count is 589 active drill rigs as of Dec. 13, according to Baker Hughes. Active US rig counts are 6% lower than rates seen this time last year.
Canadian drilling activity has eased since peaking in October. This typical seasonal decline is experienced toward the end of each year. The active rig count was 191 rigs as of Dec. 13. Canadian rig activity is up 3% compared to levels recorded one year prior.
Crude stock levels
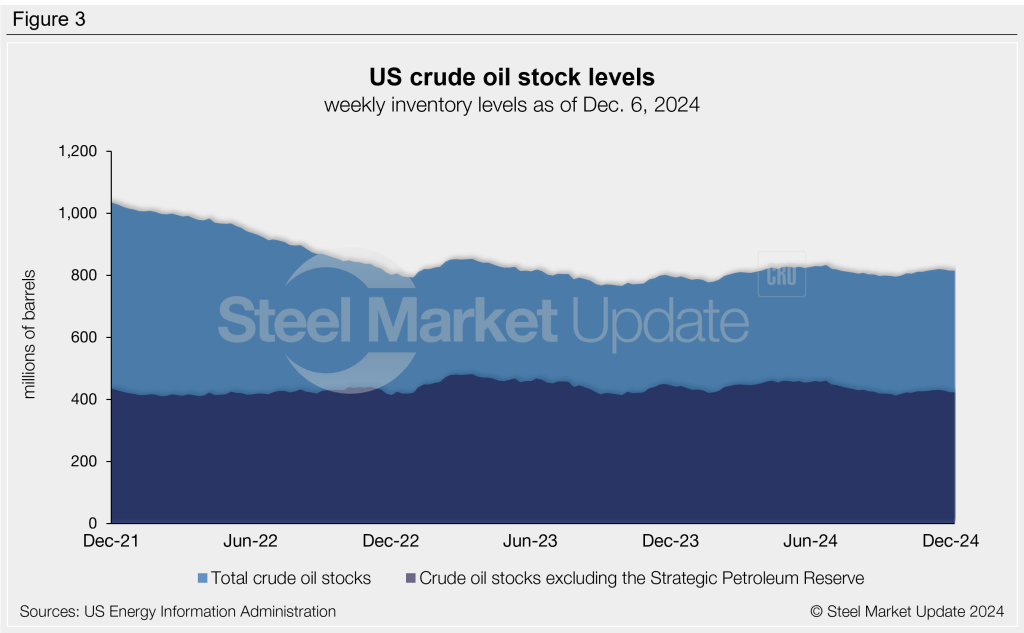
Following the seven-month low of 795 million barrels recorded in September, US crude oil stocks have marginally recovered over the past few months. Stocks reached a nearly five-month high of 819 million barrels in mid-November. The latest US stock level is down to 814 million barrels as of Dec. 6. That’s 3% higher than this time last year (Figure 3).