

Market Data
September 17, 2024
SMU Steel Demand Index suggests further demand contraction
Written by David Schollaert
Steel Market Update’s Steel Demand Index ticked back seven points last week, falling further into contraction territory.
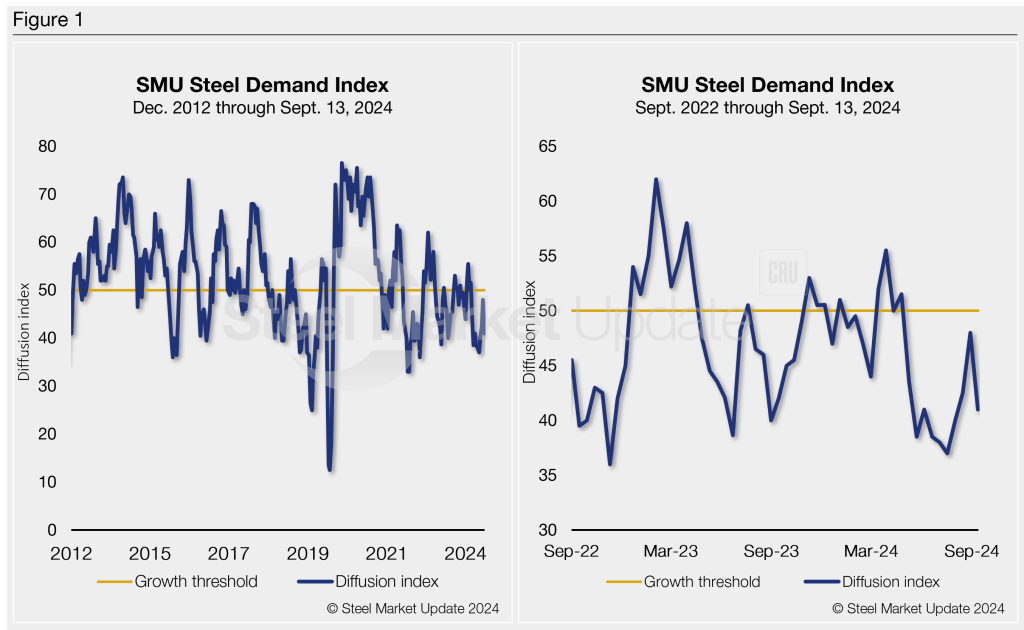
The Steel Demand Index, compiled from our weekly survey data, now stands at 41, down from 48 at the end of August. The decrease puts the index back to one of the lowest readings of 2024.
The index – down 14.5 points from a recent high of 55.5 in March – keeps signaling lower demand. Prices and lead times also struggle to find higher footing even as mills publish higher tags.
Methodology
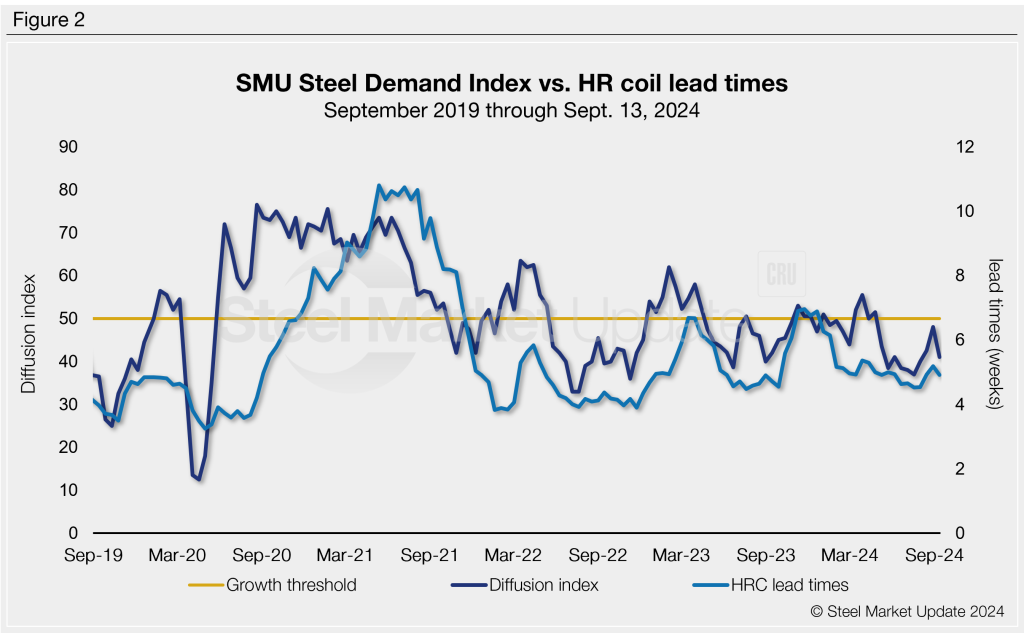
Derived from the market surveys SMU conducts every two weeks, the index compares lead times and demand to create a diffusion index. This index has historically preceded lead times, which is notable given that lead times are often seen as a leading indicator of steel price moves. An index score above 50 indicates rising demand, and a score below 50 suggests declining demand.
Figure 1 shows the nearly 12-year history of the index on the left and provides a closer look at the Steel Demand Index readings of the past two years on the right.
State of play
Falling prices and slumping demand turned the index into contraction in mid-April. Despite some short-lived momentum from mill price hikes, the index hasn’t moved out of contraction territory since. Overall, the flat-rolled steel market is still struggling to find its footing. While mills push for higher prices, buyers remain cautious, concerned about bloated inventories and weak end-market demand.
Sheet buyers continue to find mills willing to talk price, though not as aggressively as a month ago. SMU’s Current Buyers’ Sentiment edged back down to six points shy of the lowest marks so far this year. Two separate July readings of 34 were the lowest the index has been since August 2020.
Lead times have also ticked back down to just below the 5-week mark at 4.91 weeks on average. Hot-rolled (HR) coil prices have seen a similar trend, with prices easing by $5 per short ton (st) last week to an average of $685/st. HR prices are still $20/st higher than a month ago despite the recent declines.
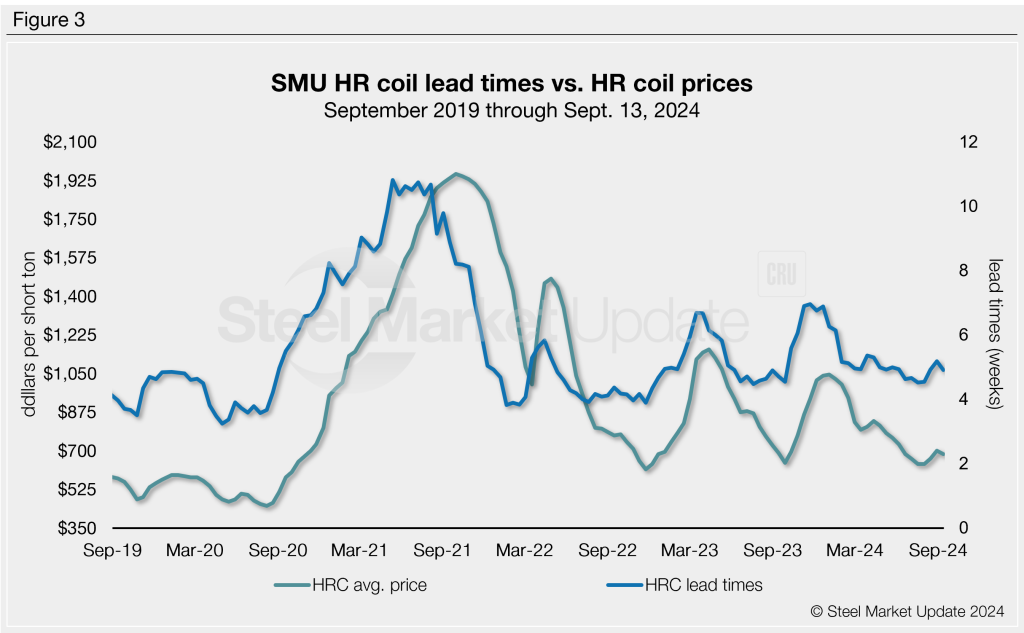
For nearly a decade, SMU’s demand diffusion index has preceded moves in steel mill lead times (Figure 2), and SMU’s lead times have also been a leading indicator of flat-rolled steel prices, particularly for HRC (Figure 3).
What to watch for
Despite the lower reading, 69% of our survey respondents still report stable or improving demand. That’s something to keep an eye on as we move into Q4. Still, 31% report declining demand, and that’s up from 23% in late August.
US mills continue to push for higher prices. Nucor held its CSP at $720/st this week after incrementally pushing prices $30/st higher over the past month.
Cliffs has done similarly, increasing its September price by $30/st and targeting $750/st. The latest increase comes after the Cleveland-based steelmaker reportedly placed its C-6 blast furnace at Cleveland Works on hot idle until demand improves.
The index has reached growth territory only a handful of times since late April 2023. All those gains were short-lived bumps when the market responded to mill price hikes.
Time will tell if the latest round of mill price increases will help rally the market or if SMU’s Steel Demand Index will continue to bump around in contraction territory as we move into the last quarter of 2024.
Note: Demand, lead times, and prices are based on the average data from manufacturers and steel service centers participating in SMU’s market trends analysis surveys. Our demand and lead times do not predict prices but are leading indicators of overall market dynamics and potential pricing dynamics. Look to your mill rep for actual lead times and prices.


