Analysis
August 15, 2024
July energy market update
Written by Brett Linton
This Premium analysis covers North American oil and natural gas prices, drilling rig activity, and crude oil stock levels. Trends in energy prices and rig counts are an advanced indicator of demand for oil country tubular goods (OCTG), line pipe, and other steel products.
The Energy Information Administration’s (EIA) July Short-Term Energy Outlook (STEO) was released earlier this month, forecasting spot prices, production, and inventories for crude oil and natural gas. Crude oil prices are expected to rise through the second half of the year, similar to last month’s forecast. Natural gas prices are forecast to remain low through Q3’24 and then experience typical seasonal increases through Q1’25. You can view the latest EIA Short-Term Energy Outlook here.
Oil and gas spot prices
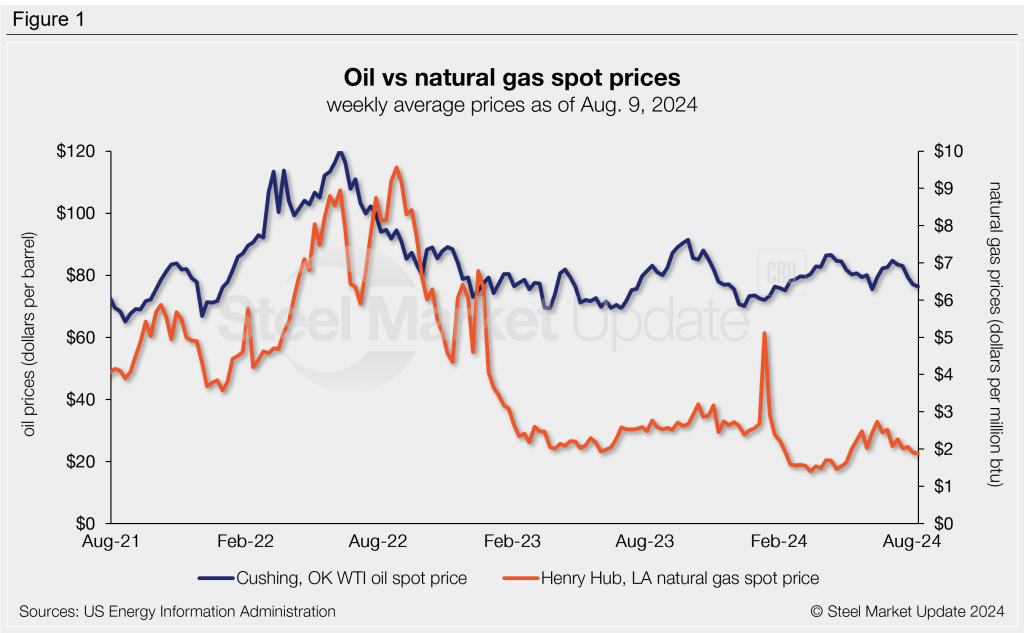
The weekly West Texas Intermediate oil spot market price has remained rangebound across the last two years, hovering between $70-90 per barrel (b) since September 2022. The spot price has decreased over the previous five weeks, falling to a two-month low of $76.33/b last week (Figure 1). The EIA expects oil spot prices to recover soon and average between $85-90/b by the end of the year, which is in line with their prior estimates. Their 2025 forecast has been revised downwards to $88/b, attributed to reduced consumption.
Following historical lows seen earlier this year, natural gas spot prices ticked up in May and June but have trended downward since July. Recall that in March, prices fell to a 25-year low of $1.40 per metric million British thermal units (mmBtu). The EIA attributed these low prices to historically high inventory levels due to reduced winter consumption. Natural gas prices fell to a three-month low of $1.88/mmBtu last week. The July STEO forecasts natural gas to remain below $2.50/mmBtu for the next three months. EIA forecasts natural gas prices from November through March to average $3.10/MMBtu, following regular seasonal patterns. This increase is supported by increased seasonal heating demand and higher gas exports from new Texas and Louisiana facilities.
Rig counts
The number of active US oil and gas drill rigs has stabilized over the last six weeks, remaining near a two-and-a-half-year low (Figure 2). According to Baker Hughes, the latest US count was 588 active drill rigs as of August 9. Active US rig counts are 10% lower than last year.
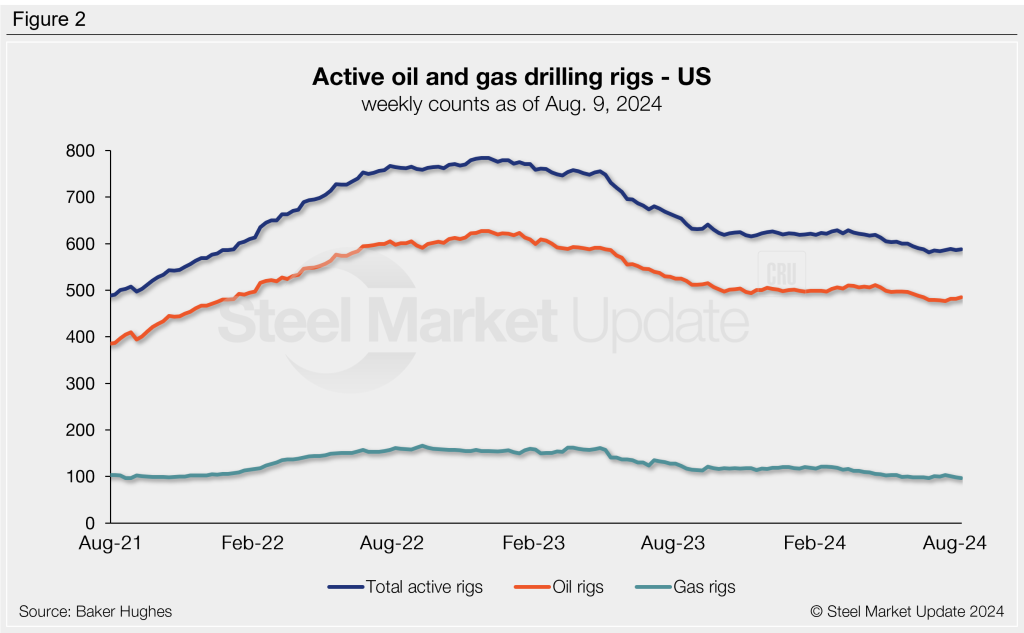
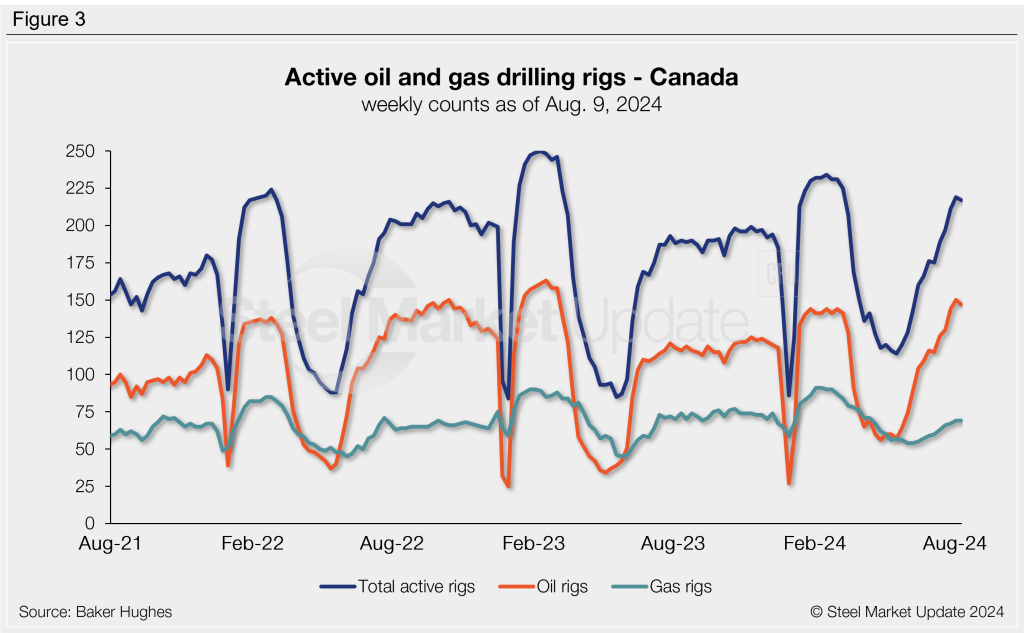
Canadian rig activity continues to improve after bottoming out in May, nearing a five-month high of 217 rigs just last week. As seen in Figure 3, Canadian counts experience seasonal swings each spring as warmer weather sets in and thawing ground conditions limit access to roads and sites. Canadian rig activity is up 14% compared to levels recorded one year prior.
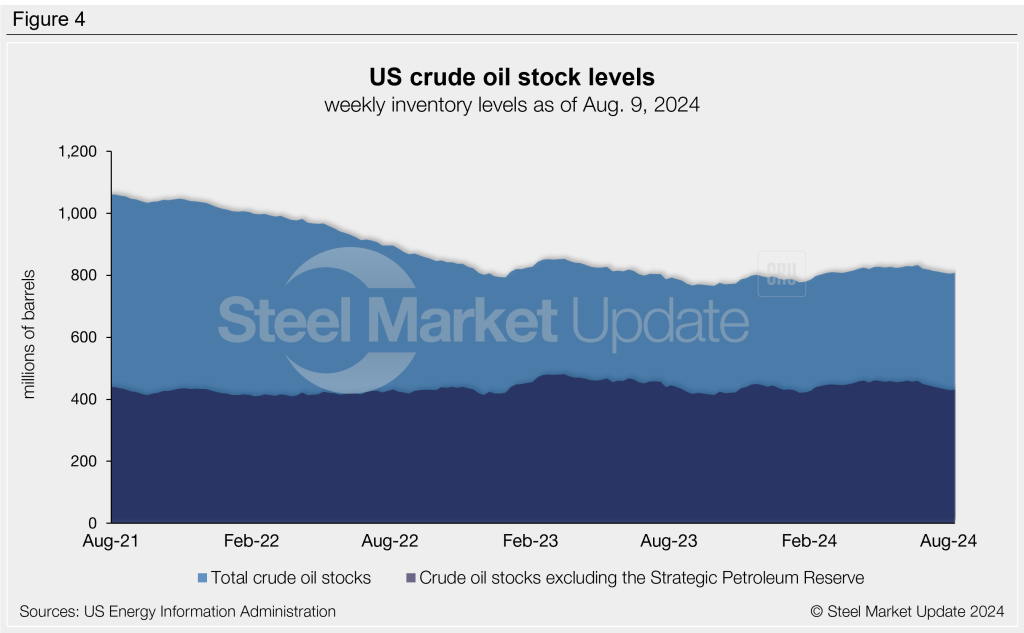
Stock levels
US crude oil stocks have eased over the last two months following the 14-month high in June. Earlier this month, US stock levels declined to a nearly six-month low of 805 million barrels. The August 9 rate is up slightly to 807 million barrels. While down, July stocks are 3% higher than levels at the start of the year and up by 2% vs levels one year ago (Figure 4).