Market Data
July 22, 2024
Some SMU Key Market Indicators improve, others remain near historic lows
Written by David Schollaert
Editor’s note: Steel Market Update is pleased to share this Premium content with Executive members. For information on how to upgrade to a Premium-level subscription, contact Luis Corona luis.corona@crugroup.com.
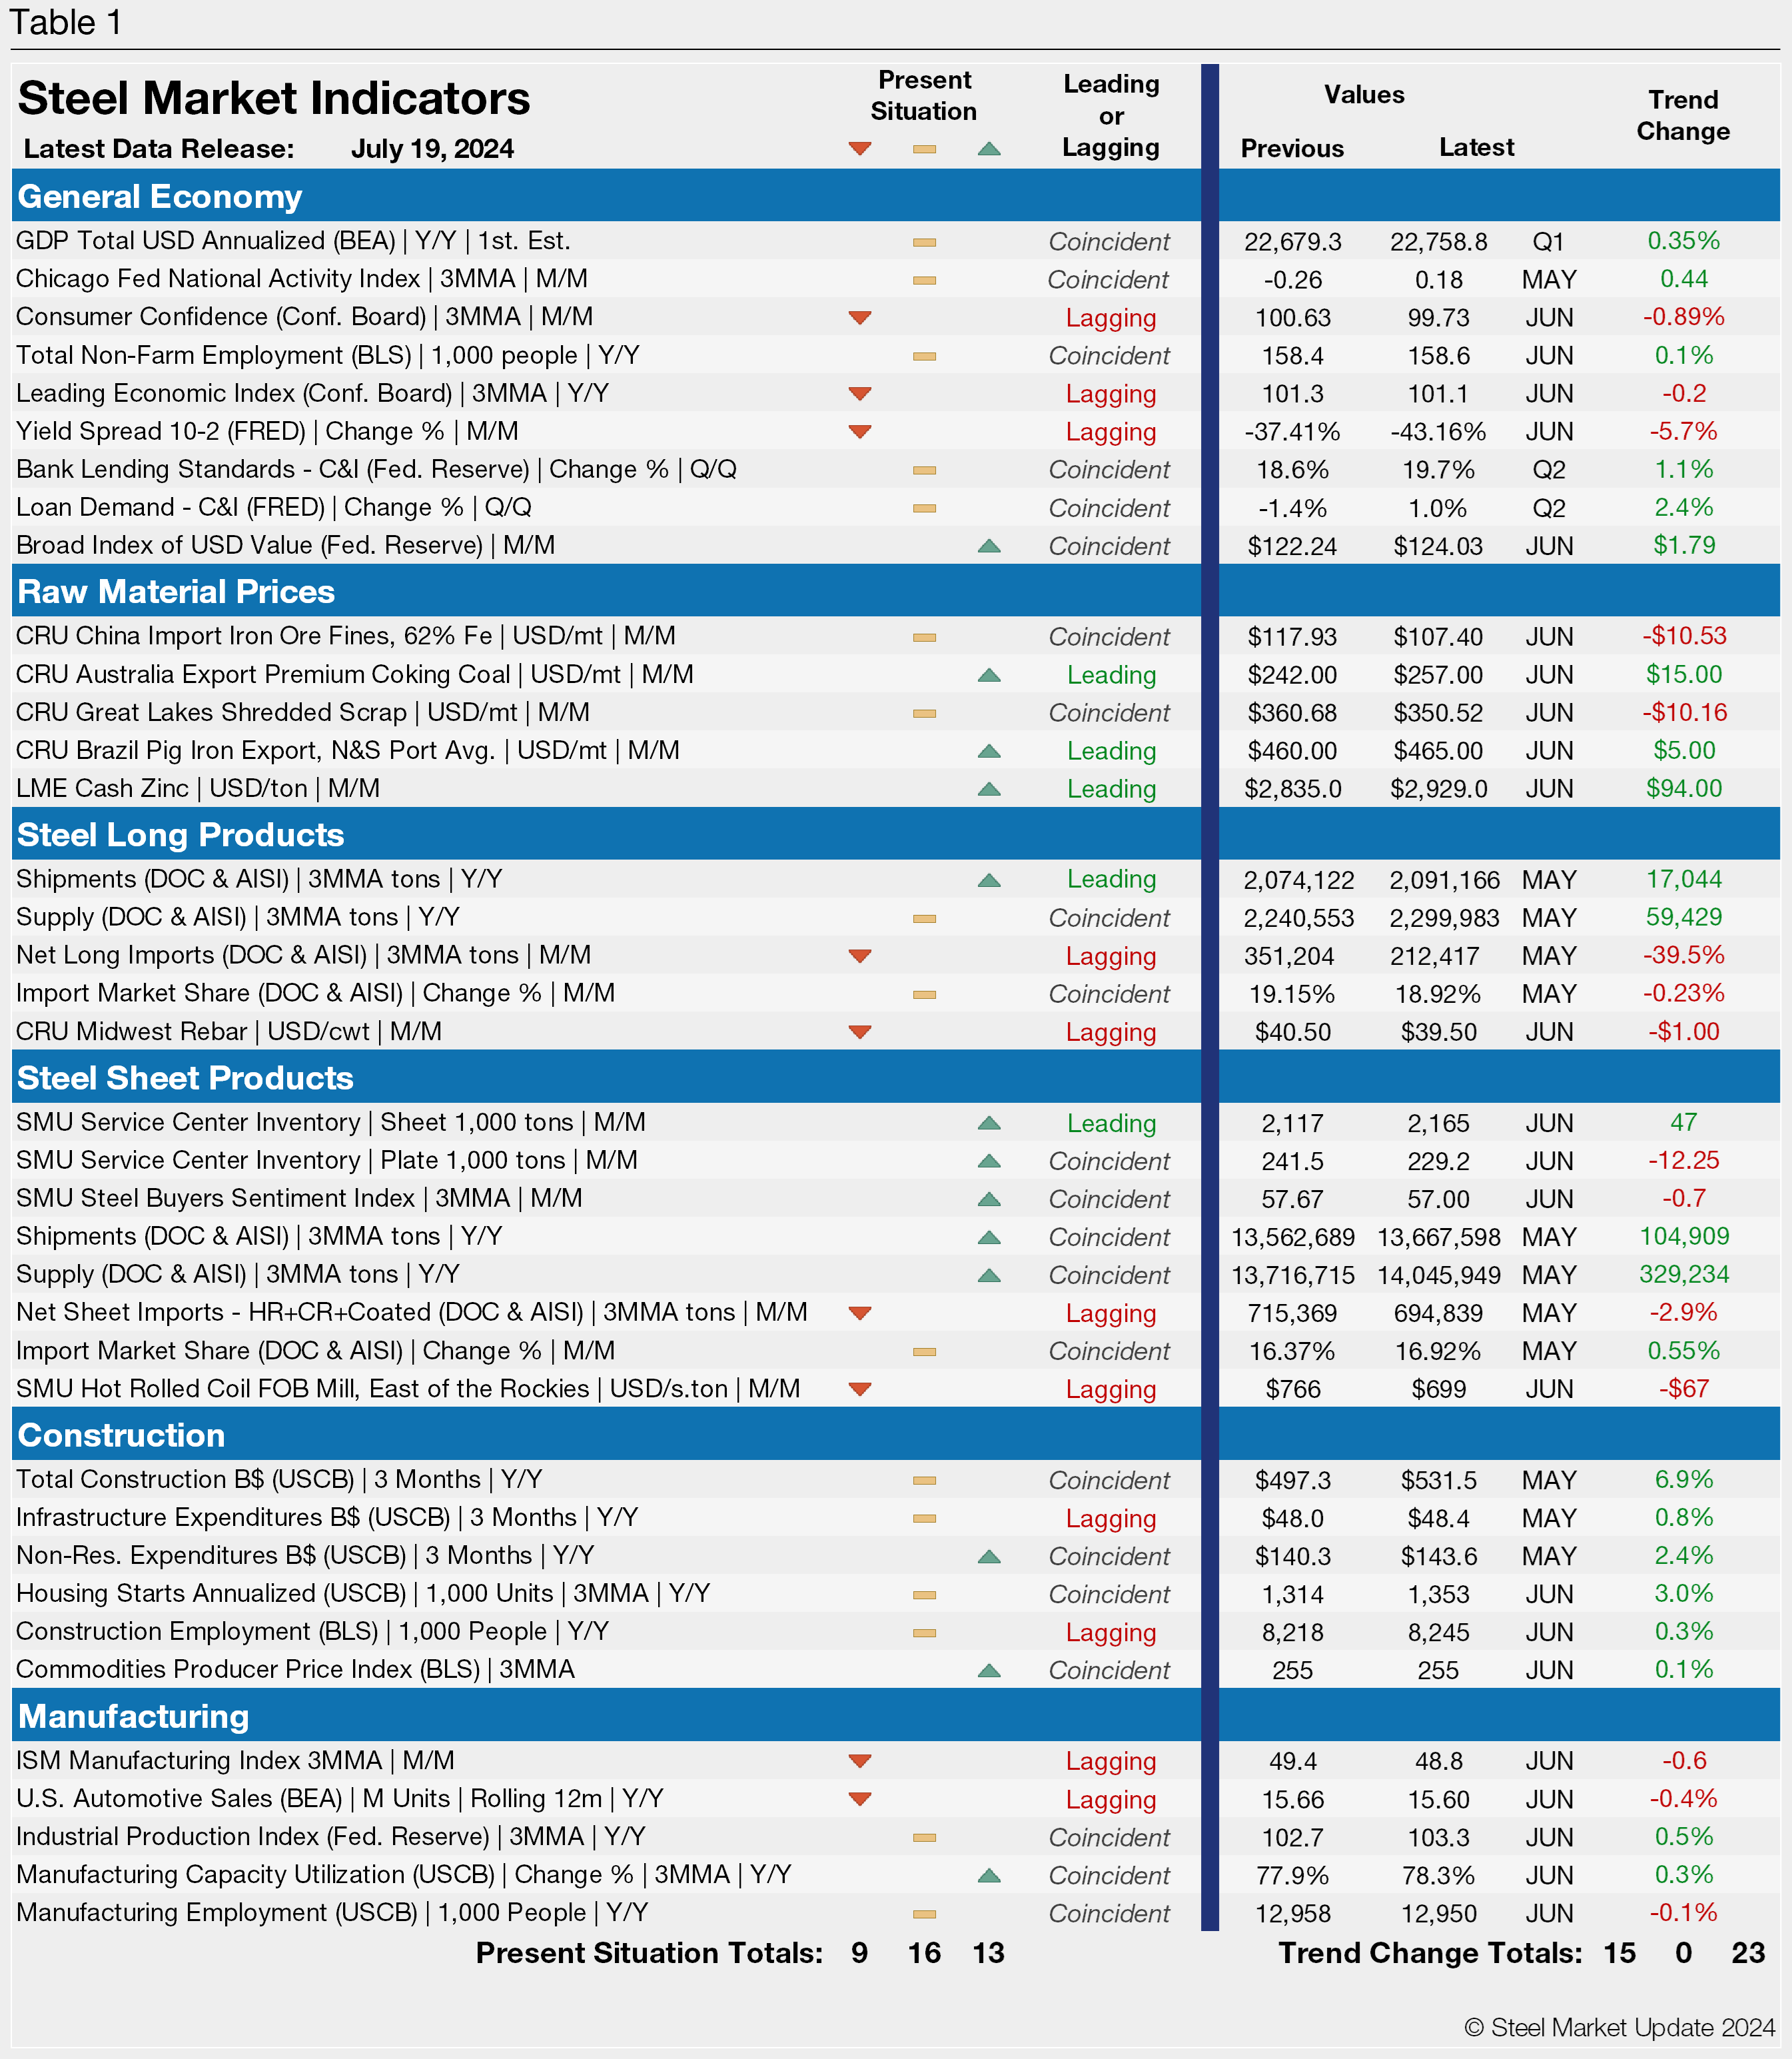
SMU’s Key Market Indicators include data on the economy, raw materials, manufacturing, construction, and steel sheet and long products. They offer a snapshot of current sentiment and the near-term expected trajectory of the economy.
All told, nine key indicators point lower, 16 are neutral, and 13 point higher. One thing worth noting: The nine indicators pointing lower are all lagging indicators. Many of those pointing upward are leading indicators.
Flat-rolled steel prices have been declining for the better part of the year, a trend highlighted by seven key indicators pointing lower.
Hot-rolled (HR) coil prices stand at their lowest mark since December 2022. Lead times are now 4.5 weeks on average for HR coil. And mills remain largely flexible on prices as they seek business beyond contracted tons.
SMU’s Steel Buyers’ Sentiment Indices, however, both recovered recently. Current Sentiment is still near a four-year low. But Future Sentiment indicates that buyers are optimistic about business prospects.
Broadly speaking, while some SMU indicators are at recent lows, others are nearing historic lows. Still others have improved. The lack of a clear direction is perhaps best characterized by the fact that most indicators remaining in a holding pattern.
Despite recent improvements, headwinds remain
The Labor Department’s Bureau of Labor Statistics (BLS) reported that consumer prices declined 0.1% in June, with core inflation being the lowest in more than three years. And the US economy added 206,000 jobs in June, ahead of consensus expectations.
But gross domestic product (GDP) increased at an annual rate of just 1.4% in Q1. Economists expect an annualized growth rate of 1.9% in Q2. And that figure is subdued compared to the second half of last year.
Consumer spending continued to prop up economic growth, despite economists’ projections that retail sales would sputter out. The Fed is closely watching economic indicators as it weighs when to start cutting the benchmark lending rate, which remains at a 23-year high.
SMU’s Present Situation and Trends analyses in the table below are based on the latest available data as of July 19. Readers should regard the color codes in the “Present Situation” column as a visual summary of the current market condition.
The “Trend” columns are color-coded to give a quick visual snapshot of the market’s direction. All data included in this table was released within the past month. The month or specific date to which the data refers to is shown in the second column from the far right. Click to expand the table below.