

Manufacturers/End Users
July 19, 2024
US light-vehicle sales dip on June cyberattack
Written by David Schollaert
US light-vehicle (LV) sales fell to an unadjusted 1.32 million units in June, down 3.4% vs. year-ago levels, the US Bureau of Economic Analysis (BEA) reported. The year-on-year (y/y) dip in domestic LV sales came in with a 4% month-on-month (m/m) decline.
On an annualized basis, LV sales were 15.3 million units in June, down from 15.9 million units the month prior, and behind the consensus forecast, which called for a marginal dip at 15.8 million units.
The lower results were largely driven by a cyberattack at CDK Global – a software company that offers dealer management services for over 15,000 dealers in the US and Canada.
Auto sales fell 10% y/y, while light-trucks were down 1.7% vs. a year ago. Light-trucks accounted for 81% of last month’s sales, slightly below its year-earlier 82% share.
The average daily selling rate (DSR) was 50,844 – calculated over 26 days – down from June 2023’s 52,643 daily rate.
While the cyberattack impacted June sales, disruptions have been largely resolved, potentially a boost for July sales.
Despite the attack, the first half of 2024 saw a 2.1% boost in sales y/y. The results was driven by a combination of stable supply levels, falling vehicle prices, and rising incentives.
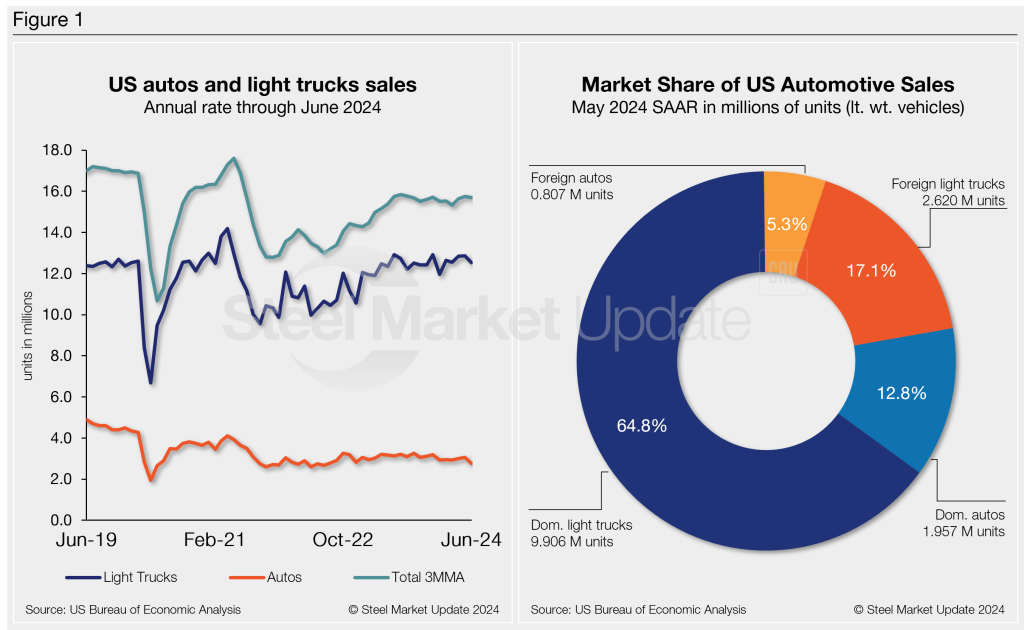
Below in Figure 1 is the long-term picture of sales of autos and lightweight trucks in the US from 2019 through June 2024. Additionally, it includes the market share sales breakdown of last month’s 15.3 million vehicles at a seasonally adjusted annual rate.
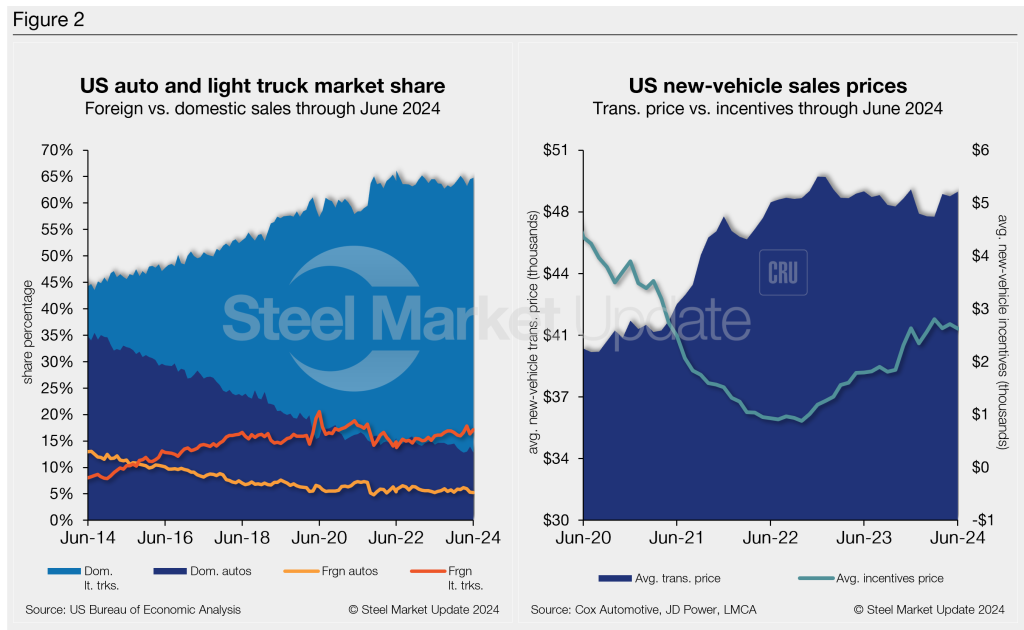
The new-vehicle ATP (average transaction price) was $48,644 in June, up 0.5% from May. Last month’s ATP was just 0.1% (-$27) below the year-ago period, according to Cox Automotive data.
Incentives slipped last month after increasing in May. Since hitting a 35-month high of $2,800 in March, incentives have fluctuated m/m. In June, incentives dipped 3.1% to $2,625 vs. the prior month. With the m/m decrease, incentives are roughly 5.4% of the average transaction price. Incentives are up about 46%, or $827, y/y.
The annualized selling rate of light trucks for June was 12,526 million units, down 2.6% vs. the prior month and 3.1% lower y/y. Annualized auto selling rates saw similar dynamics, though at a higher rate, down 9.7% and 11.9%, respectively.
Figure 2 details the US auto and light-truck market share since 2014 and the divergence between average transaction prices and incentives in the US market since 2020.
Editor’s Note: This report is based on data from the US Bureau of Economic Analysis (BEA), LMC Automotive, JD Power, and Cox Automotive for automotive sales in the US, Canada, and Mexico. Specifically, the report describes light-vehicle sales in the US.


