

Market Data
June 21, 2024
SMU Steel Demand Index falls to 19-month low
Written by David Schollaert
Steel Market Update’s Steel Demand Index ticked down 2.5 points last week, slipping further into contraction territory, according to our latest survey data.
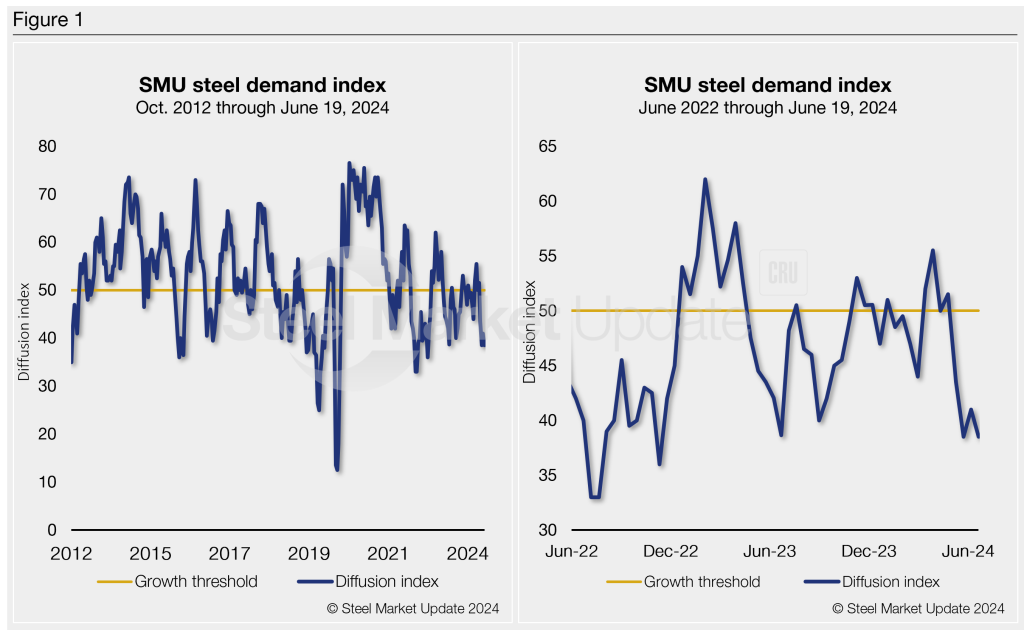
SMU’s Steel Demand Index now stands at 38.5, down from 41 at the beginning of June. The decrease puts the index at its lowest measure since November 2022.
The reading – down 17 points from a recent high of 56.0 in March – keeps signaling lower demand as prices and lead times trend lower.
Methodology
The index, which compares lead times and demand, is a diffusion index derived from the market surveys we conduct every two weeks. This index has historically preceded lead times, which is notable given that lead times are often seen as a leading indicator of steel price moves.
An index score above 50 indicates rising demand, and a score below 50 suggests declining demand. In Figure 1, the historical and the latest Steel Demand Index readings are detailed side by side.
State of play
Falling prices and slumping demand turned the index to contraction last month. Despite a slight uptick in early June, and a brief stint of growth from early Q2 buying and mill price hikes, the index has remained in contraction for most of the year. The recent short-lived boost has given way to a bearish undertone, with prices and lead times moving lower.
Sheet buyers continue to find mills willing to talk price. After recovering slightly earlier in the month, SMU’s Current Buyers’ Sentiment fell to one of the lowest marks since August 2020.
Lead times have also moved lower – nearing 4.5 weeks on average, the lowest level since last August – and hot-rolled (HR) coil prices ticked down to $685 per short ton (st) FOB mill, east of the Rockies. That’s down $25/st week on week and down $160/st from a recent high of $845/st in early April, according to SMU’s latest check of the market on Tuesday, June 18.
It’s not all bad news. Despite the lower reading, 67% of our survey respondents still report stable or improving demand. But 33% are reporting declining demand, a four-percentage point increase from late last month.
Despite some steady market dynamics, the index has been in growth territory only a handful of times since late April 2023. All those gains have been short-lived bumps when the market responded to mill price hikes over the past year.
Besides those short-lived rallies, SMU’s Steel Demand Index has moved lower and into contraction territory for much of the past year.
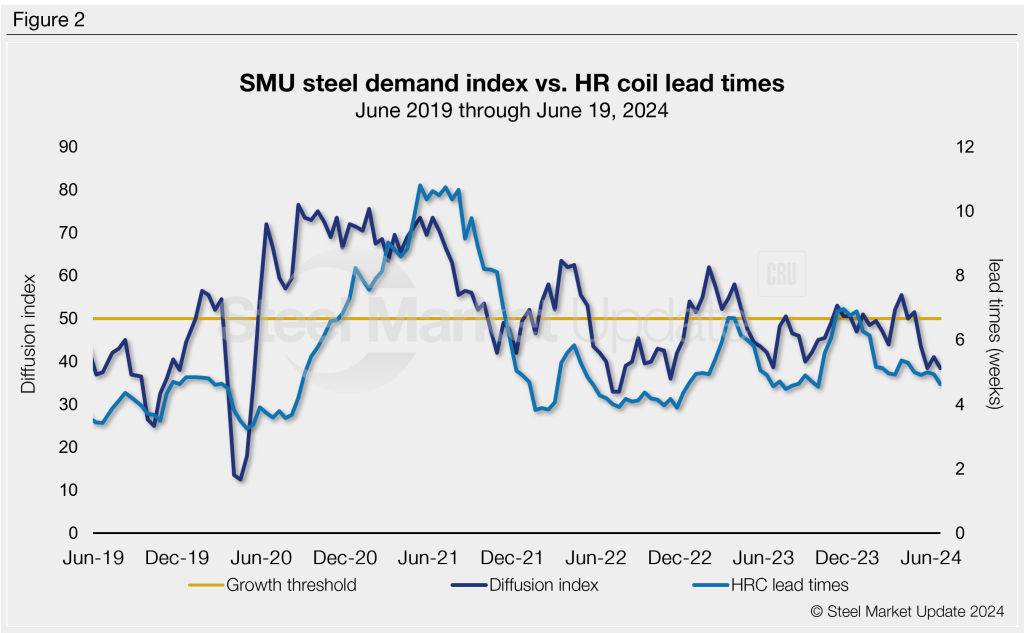
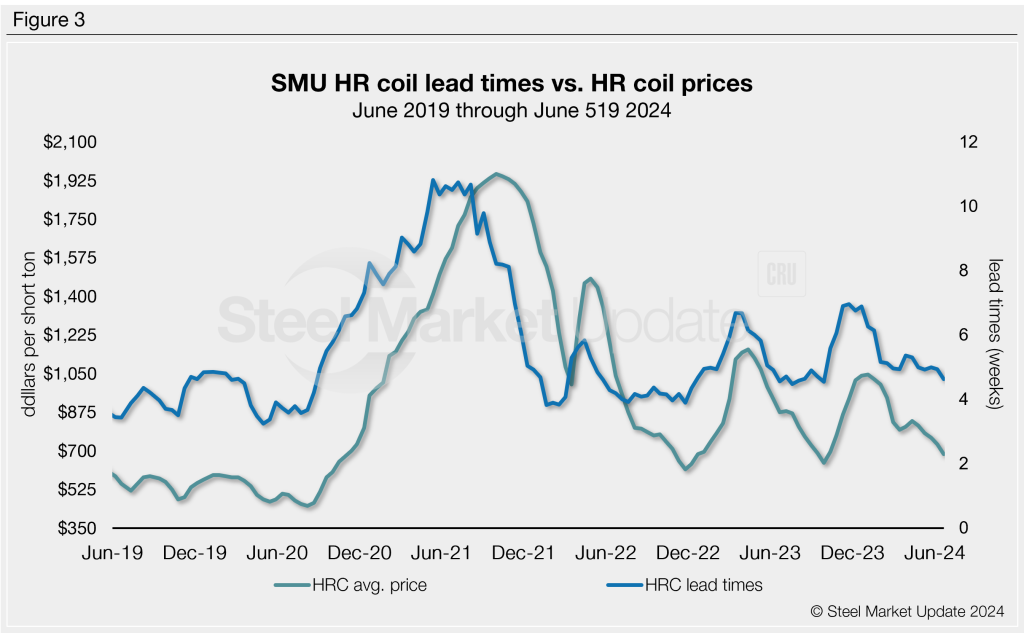
For nearly a decade, SMU’s demand diffusion index has preceded moves in steel mill lead times (Figure 2), and SMU’s lead times have also been a leading indicator for flat-rolled steel prices, particularly HRC (Figure 3).
What some SMU survey respondents had to say about demand:
“Flat to down overall. Customers holding back buying as prices are still adjusting down.”
“Soft but relatively stable.”
“Has been stable until recently, now declining with little improvement in sight.”
“Demand is steady/soft.”
“Contract buying is stable, automotive is good, spot is soft.”
“Stable at low levels.”
“Contractual business is still good, but spot business is VERY slow.”
“Construction demand is good.”
“Construction and Energy are gaining momentum.”
Note: Demand, lead times, and prices are based on the average data from manufacturers and steel service centers participating in SMU’s market trends analysis surveys. Our demand and lead times do not predict prices but are leading indicators of overall market dynamics and potential pricing dynamics. Look to your mill rep for actual lead times and prices.


