

Prices
May 16, 2024
HR futures: Grinding lower while grinding to a halt
Written by David Feldstein
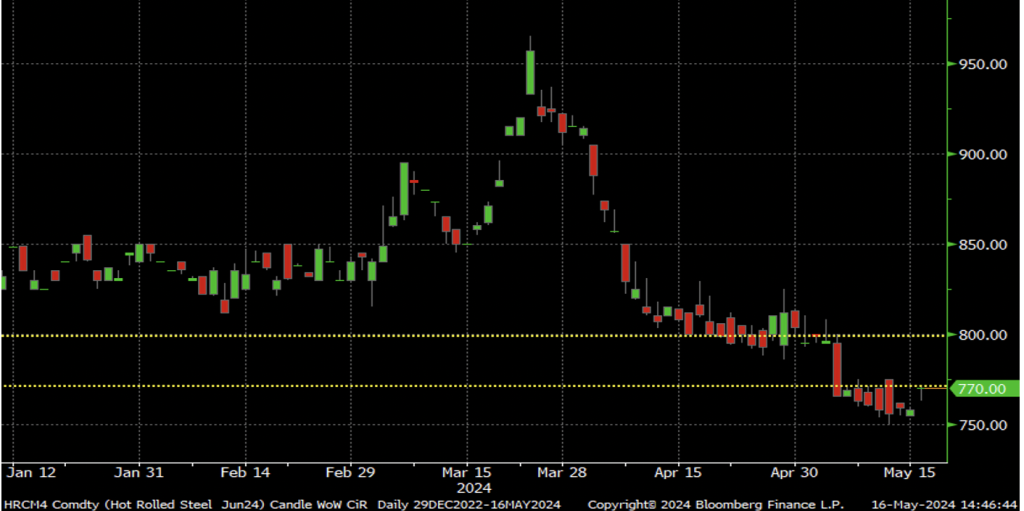
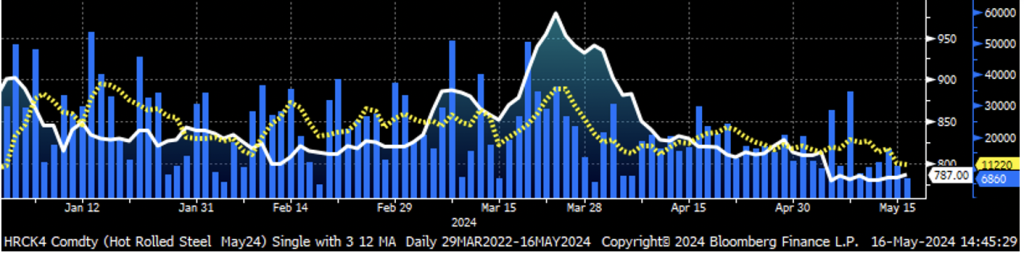
The last time we were together on April 18, the June hot-rolled coil (HRC) future was sitting around the $800 support level where the May future found a bottom in mid-February. Towards the end of April, HRC futures started to drift higher. The attempted rally quickly fizzled, but $800 still held. That is until Monday, May 6, when the June future dove to settle at $766. This clearly broke below the $800 support level as well as last August’s $771 low as the market responded to Nucor’s surprise $760 Consumer Spot Price (CSP) announcement. The June future has been trading in a range between $750-775 since.
June 2024 CME hot-rolled coil future $/st
While the front-month futures are breaking below support levels, the declines have been relatively muted. May was down only $33 and June $36, while the months from August through March 2025 saw gains of as much as $20.
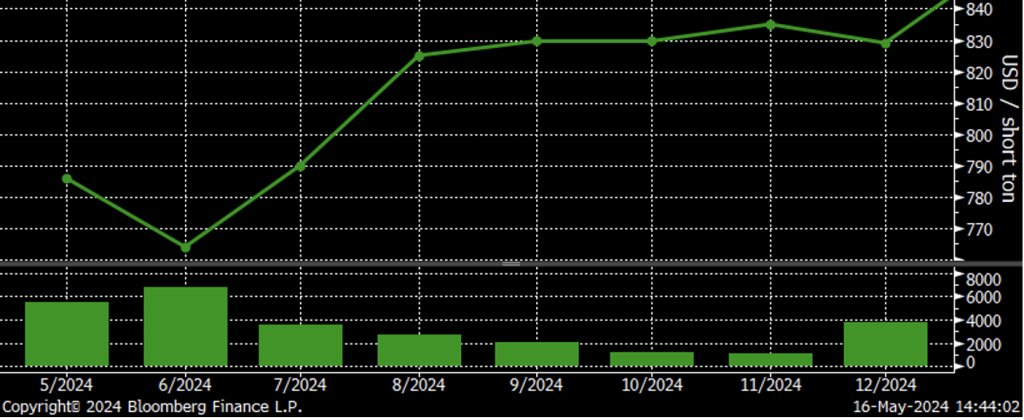
CME Midwest HRC futures curve $/st
Open interest (the number of outstanding futures contracts, or tons in this case, across the HRC futures curve) climbed to 540,000 tons as of Wednesday’s close. Open interest is on pace to easily pass April’s peak and is 20.6K tons ahead of where March’s open interest was on the 16th trading day of the month, indicating May’s open interest will reach its highest level since May 2023. Expanding open interest indicates a technically strong market, and considering the support level breaks and downtrend, the current market can be considered a technically strong bear market.
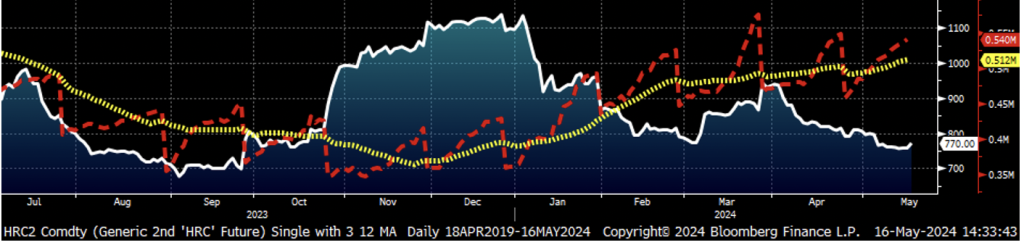
Rolling 2nd month CME HRC future $/st & open interest (red) (22-day M.A. ylw)
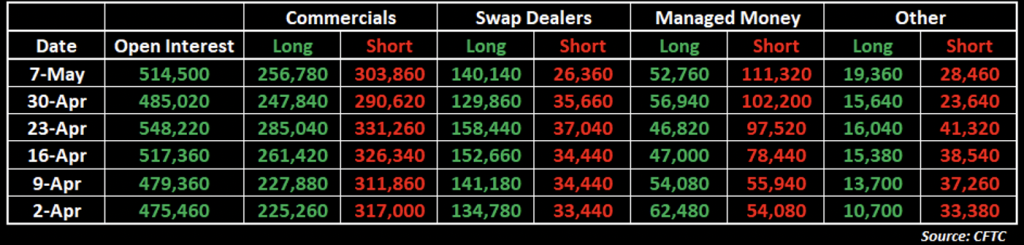
The Commodities Futures Trading Commission (CFTC) categorizes futures market participants into four categories; commercials, swap dealers, managed money, and other. Each Friday, the CFTC publishes a breakdown of open interest as of Tuesday’s close detailing the long and short positions held in aggregate by commercials (physical), swap dealers (banks), managed money (speculators), and other. As of Tuesday, May 7, commercial participants were net short 47,000 tons with 257,000 tons worth of longs and 304,000 tons of shorts. Speculators have shifted from a net long 8,400 tons on April 2 to a net short position of 58.6K tons on May 7. Specs are outright short 111,000 tons. Swap dealers are net long 114,000 tons.
Trading volume has grinded lower with the 5-day moving average falling to 11.5K t/d as of Wednesday’s close. Less than 7,000 tons were traded on Thursday as HRC futures market participants fight to stay awake.
May CME HRC future $/st w aggregate curve volume & 5-day avg.
The HRC futures curve has moved into a steep contango (upward sloping) with the June future roughly $65 below the September and October futures. Each month’s open interest is shown in the lower panel in futures terms with each future representing 20 tons.
CME Midwest HRC futures curve $/st with open interest below
Is the curve representing optimism that the current downside price pressure will be short-lived only to be followed by another breakneck rally? Or is it simply a lack of interest in the later months of the year due to economic and political uncertainty? Or is it that service centers hedging downside risk have been twice bitten by the multiple rip-roaring rallies of the past few years? Could it be end-users fixing second-half prices in the futures instead of physical market due to the elevated cost of capital? Or is the downside risk-reward ratio unattractive given the magnitude of these rallies?
Disclaimer: The content of this article is for informational purposes only. The views in this article do not represent financial services or advice. Any opinion expressed by Mr. Feldstein should not be treated as a specific inducement to make a particular investment or follow a particular strategy, but only as an expression of his opinion. Views and forecasts expressed are as of date indicated, are subject to change without notice, may not come to be and do not represent a recommendation or offer of any particular security, strategy or investment. Strategies mentioned may not be suitable for you. You must make an independent decision regarding investments or strategies mentioned in this article. It is recommended you consider your own particular circumstances and seek the advice from a financial professional before taking action in financial markets.


