

Market Data
November 15, 2023
SMU Steel Demand Index Improves Again, Moves Into Expansion Territory
Written by David Schollaert
Steel Market Update’s Steel Demand Index has moved into growth territory after seeing steady improvement since mid-September, according to our latest survey data.
The latest developments come on the heels of repeated mill price increases, maintenance outages, and idlings. These dynamics have helped push hot-rolled coil lead times out, reaching nearly seven weeks on average.
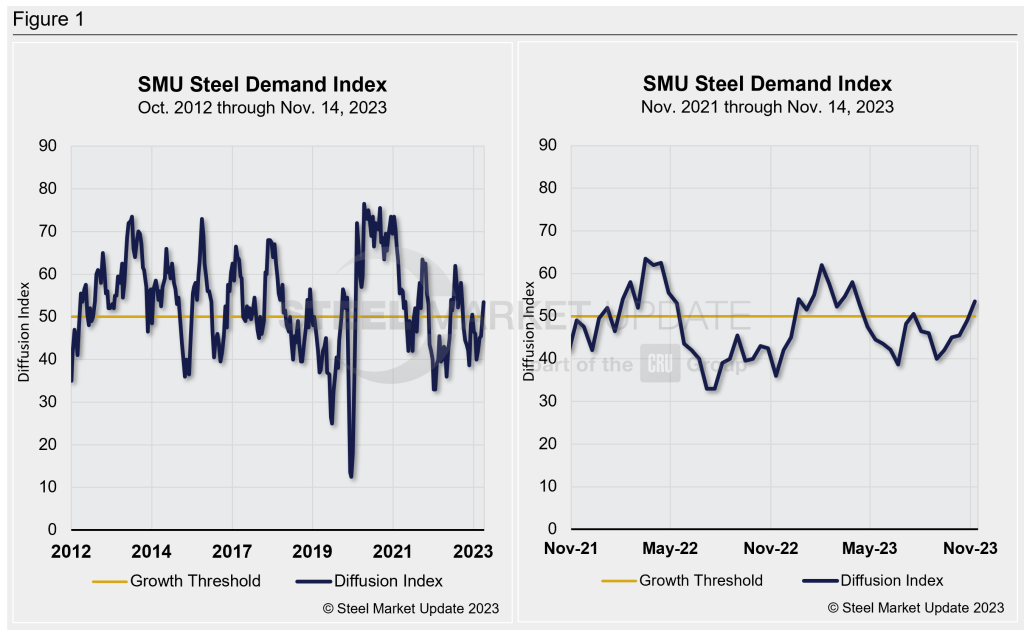
SMU’s Steel Demand Index now stands at 53.5, up 4.5 points from a reading of 49 at the end of October. The measure has improved by more than 13 points, however, since reaching a recent low of 40 back in late August.
Except for a short-lived bump when the market responded to mill price hikes in mid-June, SMU’s Steel Demand Index had been largely trending downwards and in contraction territory since early April.
Methodology
The index, which compares lead times and demand, is a diffusion index derived from the market surveys we conduct every two weeks. This index has historically preceded lead times, which is notable given that lead times are often seen as a leading indicator of steel price moves.
An index score above 50 indicates rising demand and a score below 50 suggests declining demand. Detailed side by side in Figure 1 are both the historical views and the latest Steel Demand Index.
Current State of Play
Overall market sentiment is still mixed. While the UAW work-stoppage has come to an end, and year-end buying has been completed, some question if the boost in apparent demand has been driven by buyers’ need to get out in front of more price hikes, or if fundamental demand is indeed on the rise.
SMU’s latest check of the market on Nov. 14 placed HRC at an average of $940 per ton ($47 per cwt) FOB mill, east of the Rockies, up $75 per ton vs. the prior week. Hot band is now up nearly $300 per ton since reaching the recent low of $645 per ton in late September.
U.S. Steel’s idling at Granite City Works near St. Louis in response to the UAW strike, and Q4 mill outages helped push lead times out. Improved buying patterns as prices bottomed pushed material on order up and lead times out.
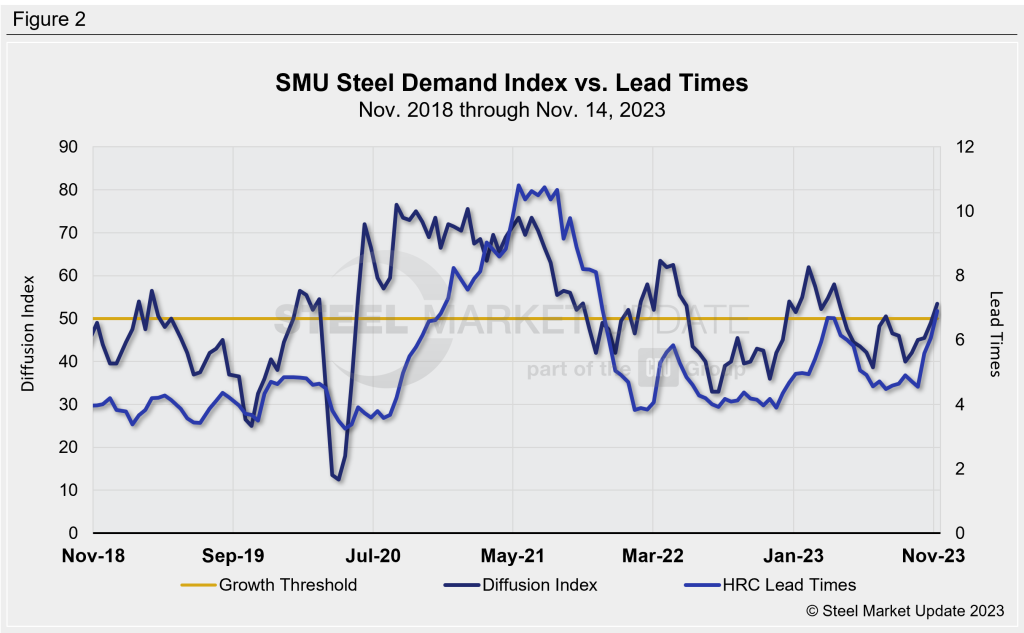
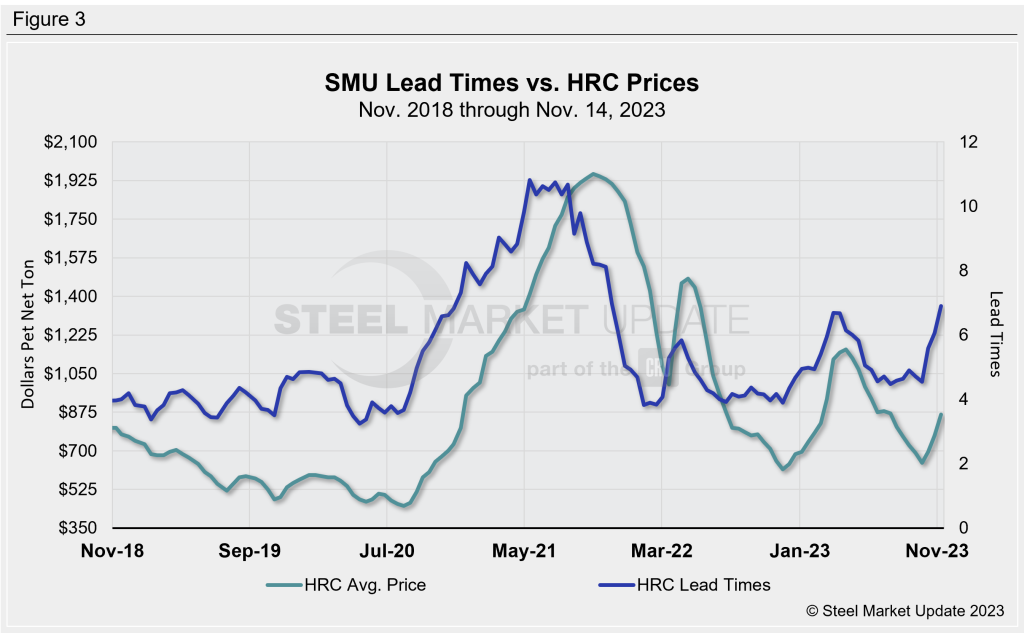
SMU’s demand diffusion index has, for nearly a decade, preceded moves in steel mill lead times. (Figure 2 shows the past five years.) Historically, SMU’s lead times have also been a leading indicator for flat-rolled steel prices, particularly HRC prices. (Figure 3 features the past five years.)
What to Watch For
It’s still important to keep a close eye on lead times. Our hot-rolled lead times averaged approximately 6.90 weeks this past week, up roughly a week from 6.06 weeks in late October. They’ve eclipsed this year’s prior high of 6.69 weeks in mid-March and could be stretching out more if buying continues at the current pace – especially if mills push for higher prices ahead of the holidays.
Note: Demand, lead times, and prices are based on the average data from manufacturers and steel service centers who participate in SMU’s market trends analysis surveys. Our demand and lead times do not predict prices but are leading indicators of overall market dynamics and potential pricing dynamics. Look to your mill rep for actual lead times and prices.


