Market Segment
September 21, 2023
HRC Futures Market Takes Off
Written by Daniel Doderer
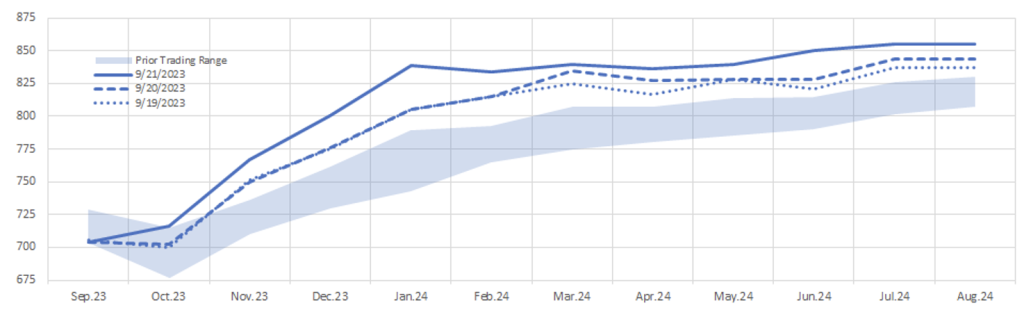
After a quiet couple of weeks, the futures market has recently come to life over the last three days, and is starting to show some bullish signals. The shaded region in the chart below shows the tight trading range from Aug. 28 to Sept. 18 (Monday). The lines below also represent futures settlements on 9/21 (solid), 9/20 (dashed), and 9/19 (dotted). The takeaway is clear, market participants believe that if we have not already seen the floor in spot pricing, we soon will.
Let’s think about some of the signals that support this recent turn. First, according to our calculations, domestic prices dipped below delivered global pricing this week. This is historically a bullish signal, albeit one that takes time to trigger a rally. Furthermore, domestic producers appear to be quickly approaching cost support (even after the recent lower settlements of scrap). Another signal comes from the plumbing of the forward curve.
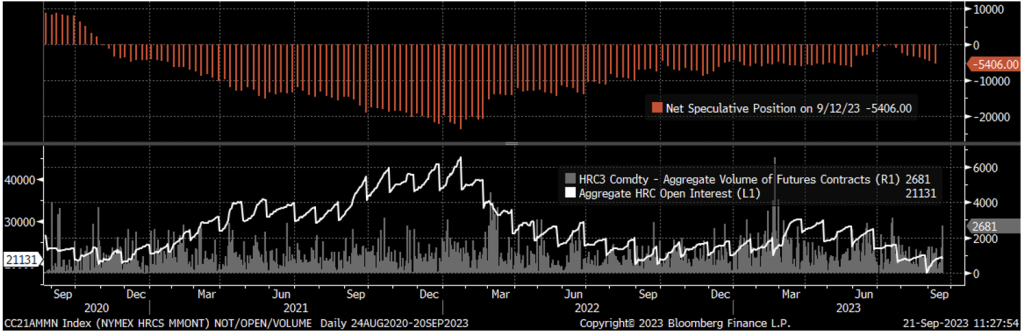
The top panel of the chart above shows “Managed Money’s” net speculative positioning (i.e., whether participants without a physical position are long or short futures) as the shortest they have been since May, through 9/12 (Tuesday). The second panel shows aggregate open interest (total amount of contracts exposed to market fluctuations) and aggregate volume (total amount of contracts that traded in each day). Through Monday, these charts were telling a clear story. Futures prices were mostly grinding lower, volume was muted but healthy, open interest was increasing – all driven by speculators getting shorter. Since then, prices have firmly broken out of that recent range with the highest volume trading day in months occurring on Wednesday. Furthermore, open interest decreased on Wednesday – a signal that participants with short positions “paid up” to cover their exposure, essentially throwing in the towel. To be clear, we will not receive confirmation that these participants were speculators for another two weeks due to the net spec data lag, but it is a reasonable expectation given the trend at the beginning of the month.
Taking all of that into account, there are good reasons to believe that the forward curve has bottomed out for the time being, but now is a good time to include our typical reminder that the forward curve is not a predictor of physical prices. Starting tomorrow, new, and unknown shocks will impact the curve in unanticipated ways, but given all the information we have today, let’s briefly look at the main upside and downside risks to this curve namely, the supply/demand balance given the United Auto Workers (UAW) strike. To start, it should be noted that the unexpected temporary idling of U.S. Steel’s Granite City Furnace ‘B,’ near St. Louis, is likely the primary factor for the recent shift in forward curve pricing, pushing supply available below anticipated demand.
Prior to that action, it was estimated that the UAW strike fund had the capacity to sustain a full strike for approximately 2.5 months. During this time, the loss in steel consumption would have been greater than the planned production outages. The main downside risk now is the strike lasting longer than anticipated. While it is not our base case, the UAW’s “stand up” style of striking could aim to disrupt the broader auto supply chain, leading to plant closures without direct strikes. In such a scenario, workers could access unemployment benefits, lasting 20-26 weeks depending on the state without the UAW needing to support them through the strike fund until those benefits expire.
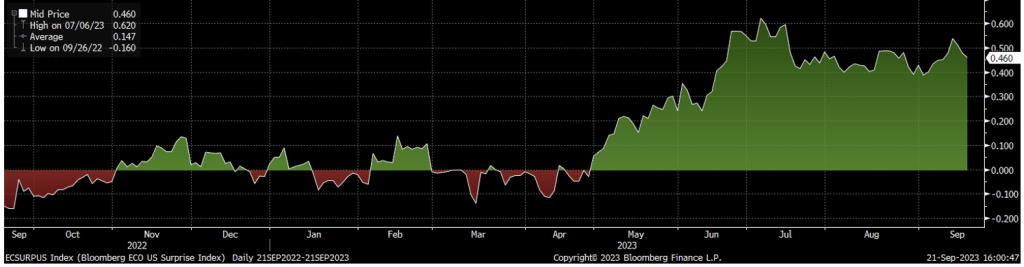
Now, taking a step back from game theory/speculation corner and looking at the broader economy: data continues to surprise to the upside, shown here by the “Bloomberg Surprise Index” for the US which is calculated as the percentage difference between the actual economic data release vs. the median of analysts’ forecasts of the same release.
This is also perfectly encapsulated by the fact that the Federal Open Market Committee (FOMC) more than doubled their expectation for year-end 2023 GDP growth from 1% to 2.1% in their latest summary of economic projections, published Sept. 20. While it is important to note that like any forecast, this should be taken with a grain of salt and there are meaningful headwinds in front of the economy the sustained resilience is encouraging. Furthermore, although these signals are broadly promising, it would be disingenuous to suggest that steel consumption has not been negatively impacted by higher interest rates, inventory management, and softening demand. However, going forward, we view the physical market as pricing in too much asymmetric downside risk going into Q4 given promising seasonal fundamentals and domestic producers eagerness to throttle back production.
About Flack Global Metals
In 2010, Flack Global Metals (FGM) was founded with the mission to reinvent how metal is bought and sold. Over 13 years later, the company has evolved into a hybrid organization combining an innovative domestic flat-rolled metals distributor and supply chain manager, a hedging and risk management group supported by the most sophisticated ferrous trading desk in the industry known as Flack Metal Bank (FMB), and an investment platform focused on steel-consuming OEMs called Flack Manufacturing Investments (FMI). Together, these entities deliver certainty and provide optionality to control commodity price risk in the volatile steel industry.
Disclaimer: The content of this article is for informational purposes only. The views in this article do not represent financial services or advice. Any opinion expressed by Flack Global Metals or Flack Metal Bank should not be treated as a specific inducement to make a particular investment or follow a particular strategy, but only as an expression of his opinion. Views and forecasts expressed are as of date indicated, are subject to change without notice, may not come to be and do not represent a recommendation or offer of any particular security, strategy or investment. Strategies mentioned may not be suitable for you. You must make an independent decision regarding investments or strategies mentioned in this article. It is recommended you consider your own particular circumstances and seek the advice from a financial professional before taking action in financial markets.