SMU Data and Models
HRC vs. Galv Price Spread Widened This Summer
Written by Laura Miller
September 15, 2023
The spread between hot-rolled coil (HRC) and galvanized sheet base prices widened throughout the summer as hot rolled prices declined faster than those of galvanized.
At summer’s start, galvanized base prices held, on average, a $170 per net ton, or 19%, premium over hot rolled prices. That spread rose to as high as $225 per ton, or 31%, during the week of Aug. 29. This week, the spread came in at $200 per ton, or 29%.
We arrived at that latest figure using the following analysis based on SMU’s weekly pricing data.
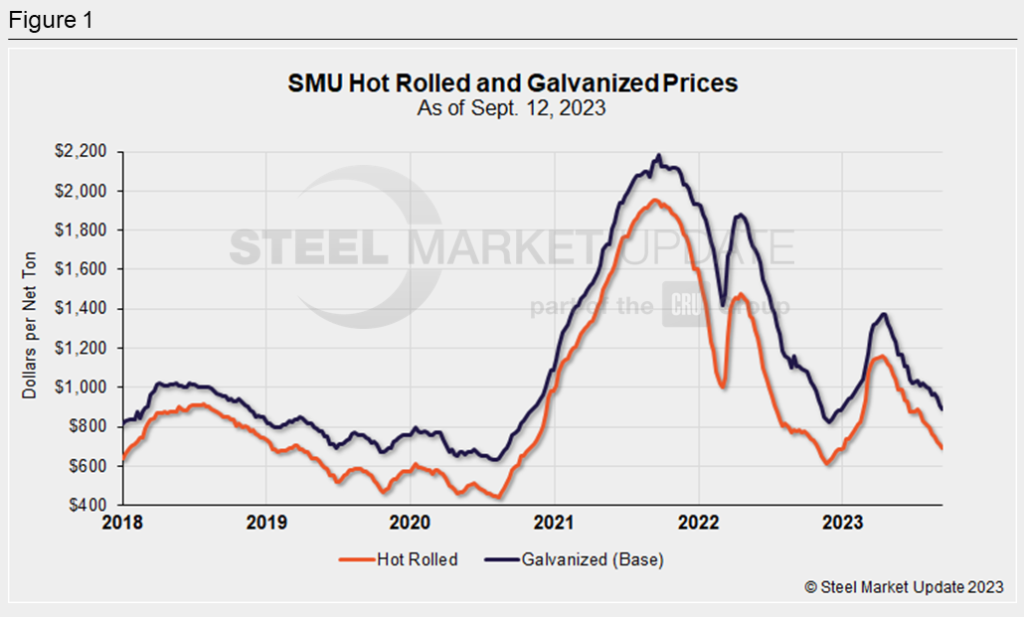
Figure 1 below shows SMU’s HRC and galvanized base prices as of Sept. 13.
The average HRC price was $975 per ton at the start of summer during the week of June 20. The price rose to as high as $890 per ton during the week of July 11. It has since fallen for nine consecutive weeks to sit at $690 per ton this week.
Galvanized sheet base prices were $1,045 per ton, on average, during the week of June 20. Prices bounced up and down throughout the summer, but that was the highest the price got. As of Sept. 12, galv prices fell for a third consecutive week to $890 per ton.
![](https://www.steelmarketupdate.com/wp-content/uploads/sites/2/2023/09/09.15.23_HRC_Galv_11111-1024x617.png)
In our last hot rolled vs. galvanized price analysis during the week of Aug. 1, the spread was $195 per ton. This week, the spread came in at $200 per ton.
As you can see in Figure 2 below, the spread is down considerably from the levels seen in 2022.
![](https://www.steelmarketupdate.com/wp-content/uploads/sites/2/2023/09/09.15.23_HRC_Galv_2-1024x611.png)
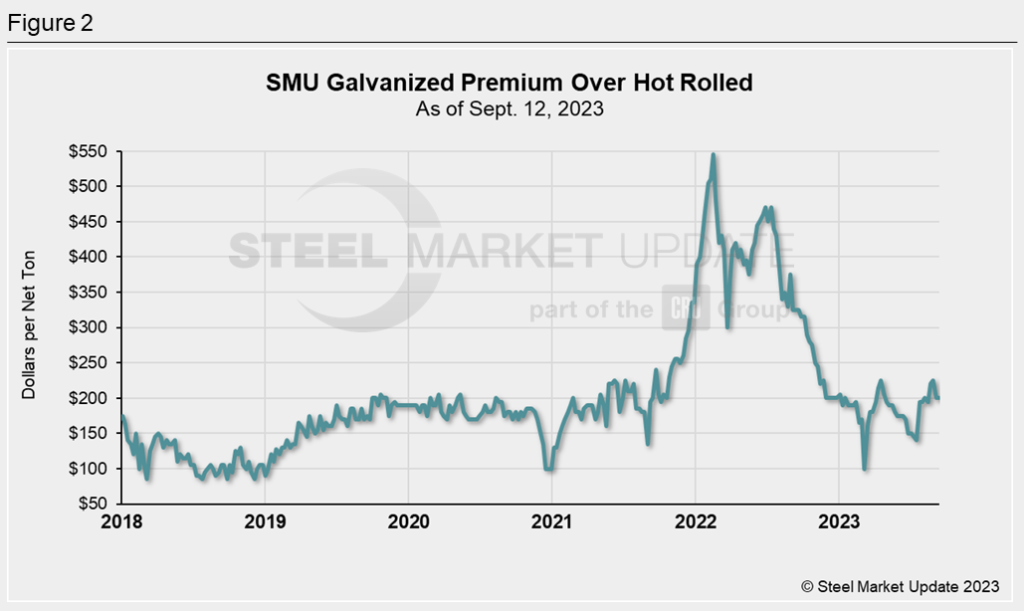
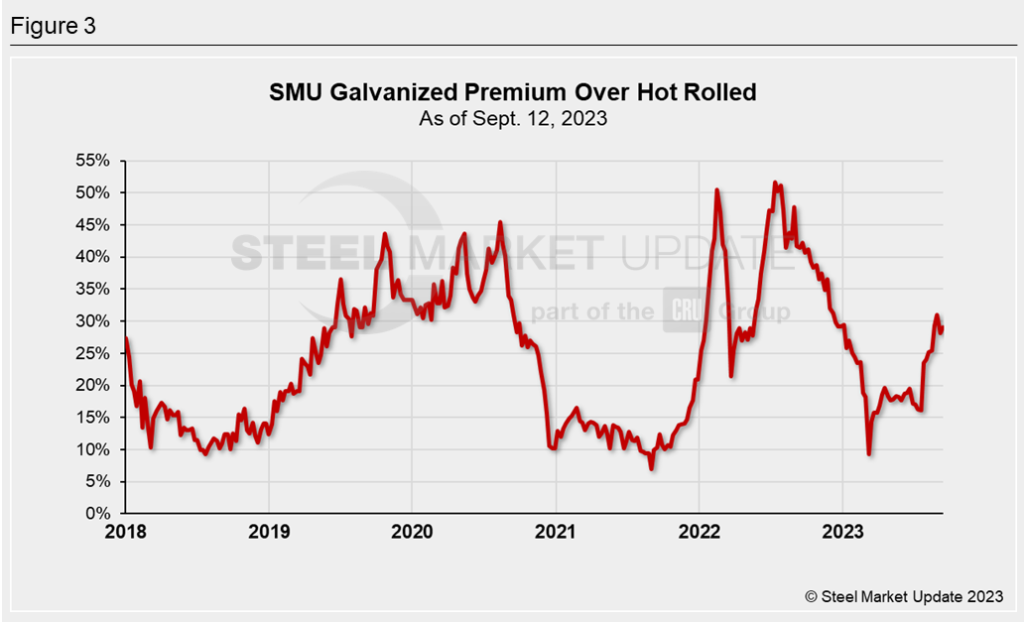
Figure 3 shows the galvanized premium over hot rolled as a percentage of the HRC price.
At summer’s start, the premium was 19%. It fell to this summer’s low of 16% during the weeks of July 11 and 18 before spiking to this year’s high of 31% during the last week of August.
This week, the spread came in at 29%.
![](https://www.steelmarketupdate.com/wp-content/uploads/sites/2/2023/09/09.15.23_HRC_Galv_3-1024x622.png)
You can chart historical HRC and galv prices using SMU’s interactive pricing tool on our website.
![](https://www.steelmarketupdate.com/wp-content/uploads/sites/2/2024/02/SMU_LM_headshot.png.jpg-150x150.png)
Laura Miller
Read more from Laura MillerLatest in SMU Data and Models
![](https://www.steelmarketupdate.com/wp-content/uploads/sites/2/2024/01/cropped-SMU_Mobile_final.png)
SMU Survey: Steel Buyers’ Sentiment indicates increased optimism
After reaching multi-month lows in mid-January, SMU’s Steel Buyers’ Sentiment Indices rebounded this week to some of the highest readings recorded in months.
![](https://www.steelmarketupdate.com/wp-content/uploads/sites/2/2024/01/cropped-SMU_Mobile_final.png)
SMU Survey: Mill lead times fluctuate, extensions expected
While we have seen some movements in recent weeks, steel mill production times remain within a few days of the historical lows observed over the last two years, a trend observed since mid-2024.
![](https://www.steelmarketupdate.com/wp-content/uploads/sites/2/2024/01/cropped-SMU_Mobile_final.png)
SMU Survey: Mills less willing to negotiate on prices
Steel mill negotiation rates have declined in each of our last two surveys; this week’s rate is the lowest recorded since March 2024.
![](https://www.steelmarketupdate.com/wp-content/uploads/sites/2/2024/01/cropped-SMU_Mobile_final.png)
SMU’s January at a glance
SMU’s Monthly Review provides a summary of important steel market metrics for the previous month. Our latest report includes data updated through January 31st.
![](https://www.steelmarketupdate.com/wp-content/uploads/sites/2/images/Featured_News_Icons/Premium1.png)
Steelmaking raw material prices mixed in January
Prices for the seven steelmaking raw materials SMU tracks moved in differing directions from December to January, according to our latest analysis.