SMU Data and Models
Apparent Steel Supply Edges Down in July
Written by David Schollaert
September 12, 2023
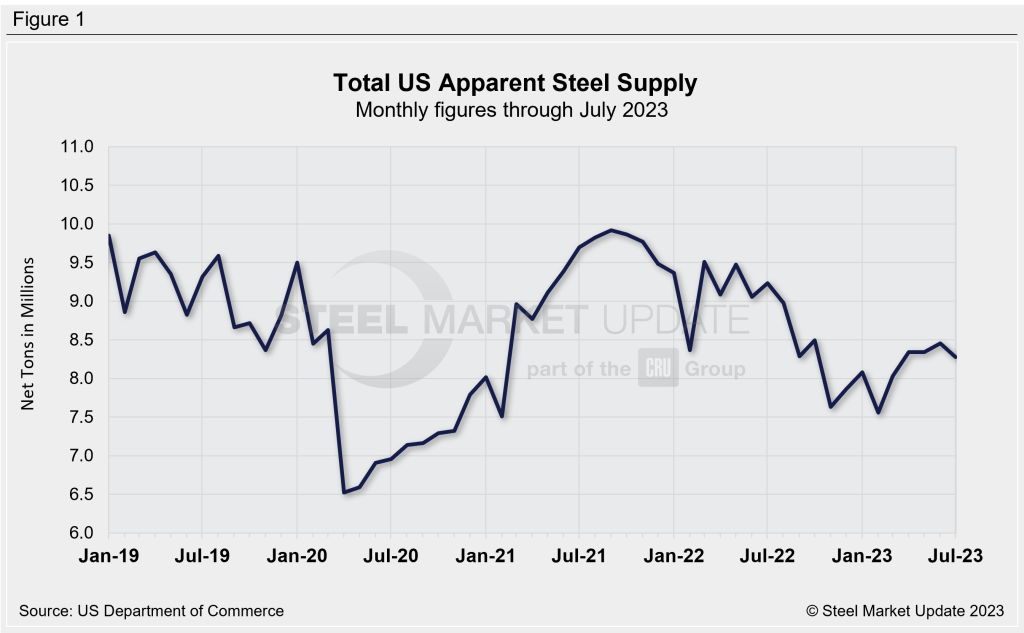
US apparent steel supply declined 2% in July to 8.28 million net tons compared to the previous month, according to data from the US Department of Commerce and the American Iron and Steel Institute (AISI).
Apparent steel supply is determined by combining domestic steel mill shipments and finished US steel imports, then deducting total US steel exports.
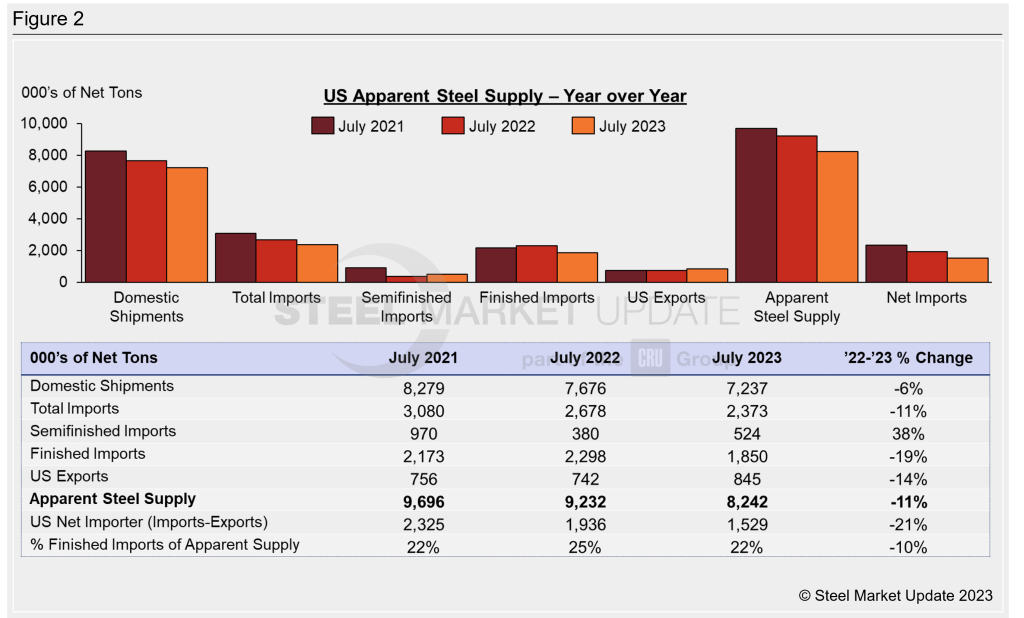
July’s apparent supply total was 952,951 tons lower than the same month one year prior when supply stood at 9.23 million tons. Figure 2 shows July trade statistics year over year (YoY) for each of the past three years.
Apparent steel supply has fluctuated for much of the year, ending slightly lower in July. Despite the month-on-month decline, apparent steel supply has remained well above its low of 7.5 million net tons seen in February. Figure 3 shows monthly statistics over the last three months.
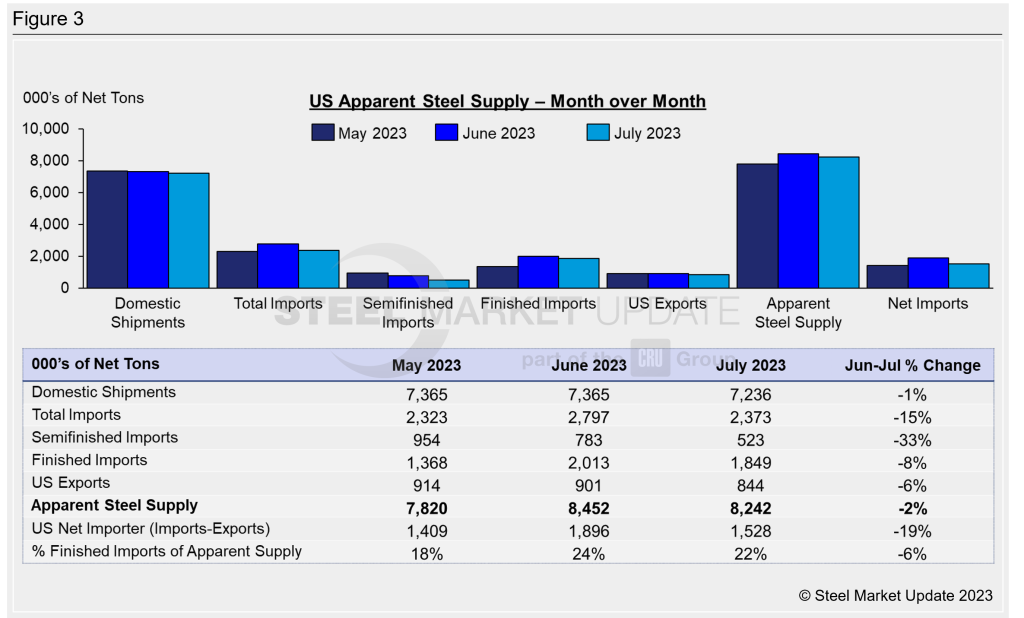
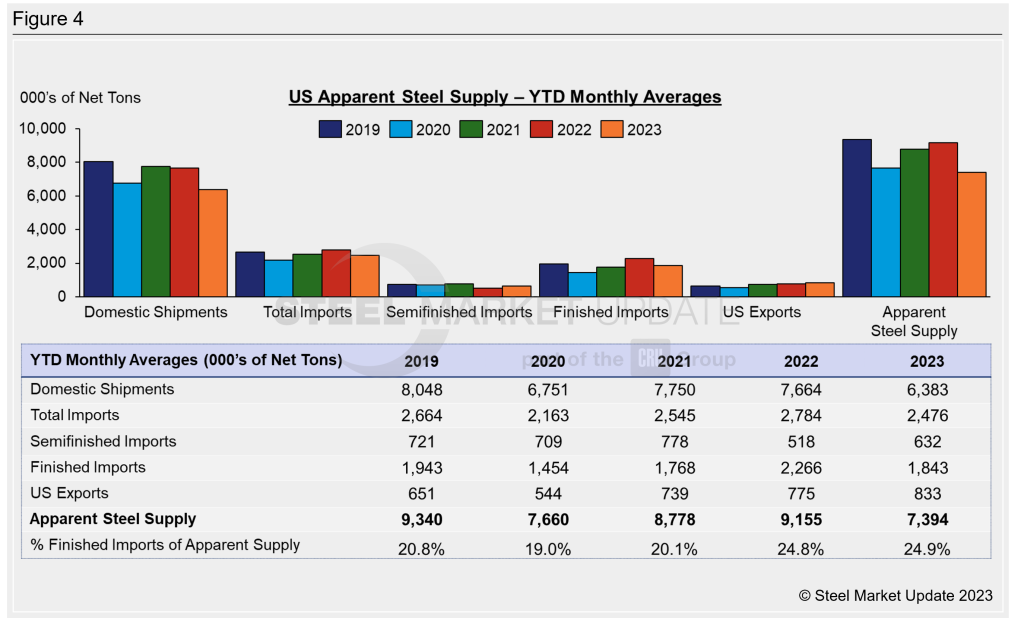
Figure 4 shows year-to-date (YTD) monthly averages for each statistic over the last five years. The average monthly apparent supply level for 2023 thus far is 8.15 million tons.
To see an interactive graphic of our Apparent Steel Supply history, click here. If you need any assistance logging into or navigating the website, contact us at info@steelmarketupdate.com.
David Schollaert
Read more from David SchollaertLatest in SMU Data and Models
SMU Survey: Current Buyers’ Sentiment Index jumps, Future Sentiment slips
SMU’s Current Buyers’ Sentiment Index rocketed up this week, while the Future Buyers’ Sentiment Index edged down. The two indices are almost at parity.
SMU Survey: Mill lead times stretch to 10-month highs
Buyers responding to our latest market survey reported that steel mill lead times were stretching out this week for sheet and plate products tracked by SMU. The results weren’t much of a surprise. Production times have begun moving out following a wave of frenzied buying in response to stricter Section 232 announced by the Trump […]
SMU Survey: Mills slam door on buyers looking to talk price
Mills’ flexibility on price for spot orders has taken a nosedive to levels not seen since the end of March 2023.
SMU Survey: Steel Buyers’ Sentiment indicates increased optimism
After reaching multi-month lows in mid-January, SMU’s Steel Buyers’ Sentiment Indices rebounded this week to some of the highest readings recorded in months.
SMU Survey: Mill lead times fluctuate, extensions expected
While we have seen some movements in recent weeks, steel mill production times remain within a few days of the historical lows observed over the last two years, a trend observed since mid-2024.