

Market Data
September 6, 2023
SMU Steel Demand Index Moves Lower
Written by David Schollaert
Steel Market Update’s Demand Index is still in contracting territory and moving lower, where it has been for the better part of the past four-plus months, according to the latest survey data. And while hot-rolled coil lead times have edged up slightly in recent weeks, demand for flat-rolled steel in the US continues to trend down.
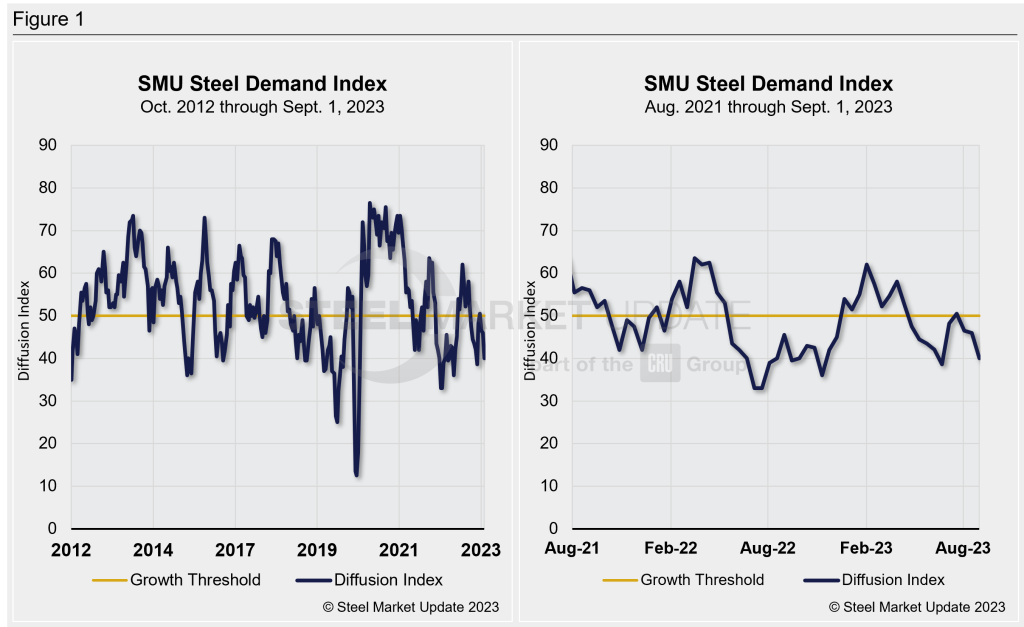
SMU’s Steel Demand Index now stands at 40, down six points from a reading of 46 in mid-August. The measure has now declined by more than 10 points over the past month and is 22 points off from the recent high of 62 reached in February. Except for a short-lived bump when the market responded to mill price hikes in mid-June, SMU’s Demand Index has now been on a downtrend since early April.
The index, which compares lead times and demand, is a diffusion index derived from the market surveys we conduct every two weeks. This index has historically preceded lead times, which is notable given that lead times are often seen as a leading indicator of steel price moves.
An index score higher than 50 indicates rising demand and a score below 50 suggests a decrease. Detailed side by side in Figure 1 are both the historical views and the latest Steel Demand Index.
Overall market sentiment remains mixed but a potential strike at union-represented automakers continues to draw a lot of attention. And while most agree that demand is down, especially for hot-rolled coil, now cold-rolled, and coated products seem to have followed.
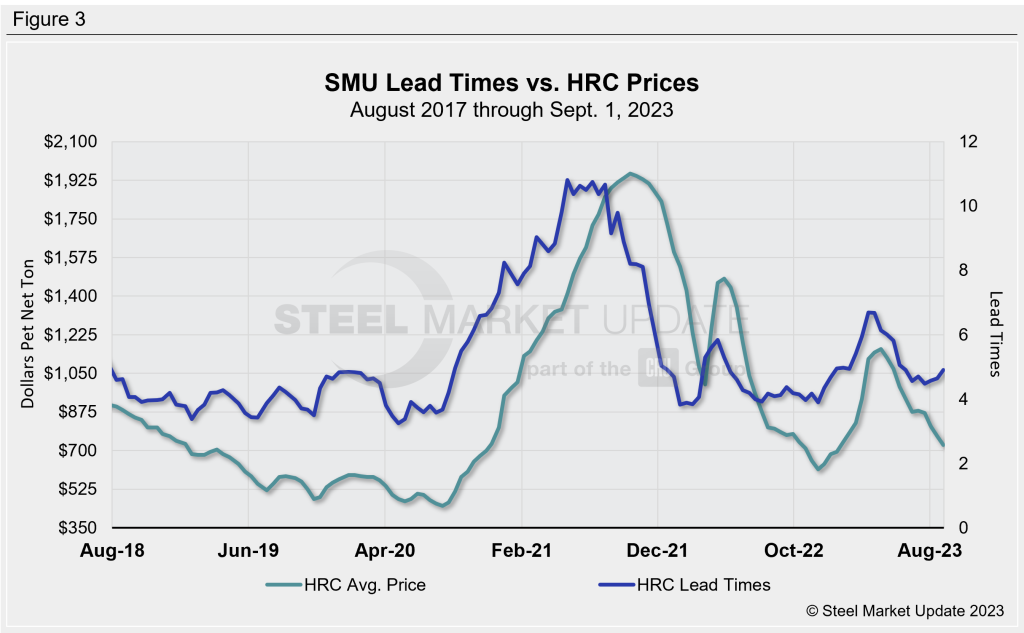
SMU’s latest check of the market on Sept. 5 placed HRC at $710 per ton ($35.50 per cwt) on average FOB mill, east of the Rockies, down $15 per ton vs. the prior week. Hot band is now down $450 per ton since reaching the recent high of $1,160 per ton in mid-April.
There are still questions regarding upcoming outages, a potential reason for the rise of material on order, even as service center inventories saw a boost in July and early results indicate that August levels may have been high as well.
With lead times currently stretching into the fourth quarter, upcoming maintenance outages or production cuts can’t come fast enough for some. Many hope post-summer seasonality provides some clarity on whether weaker demand is nearing a bottom or if we’re headed for a quiet Q4.
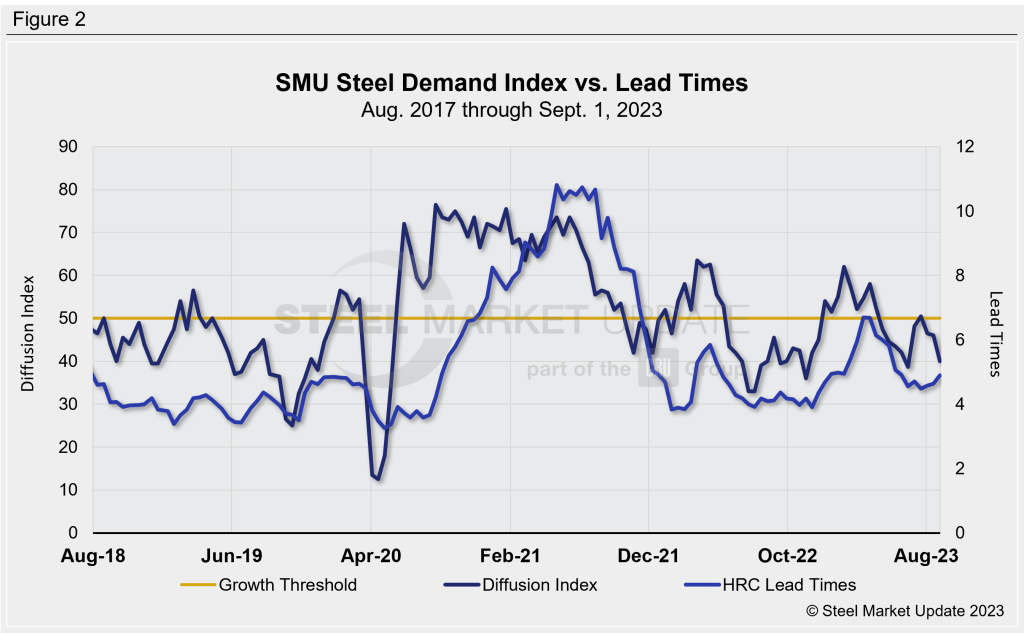
SMU’s demand diffusion index has, for nearly a decade, preceded moves in steel mill lead times. (Figure 2 shows the past five years.) Historically, SMU’s lead times have also been a leading indicator for flat-rolled steel prices, particularly HRC prices. (Figure 3 features the past five years.)
A positive trend to keep an eye on are lead times. The latest results seem to indicate a holding pattern and maybe moving up after a bit a drop in mid-July. Lead times are roughly sideways but edging up, according to our latest check of the market. And mostly sideways scrap prices anticipated for September could keep the market in more of a holding pattern for the time being.
Our hot-rolled lead times average approximately 4.90 weeks, up marginally from 4.64 weeks in mid-August. They remain far from a recent high of 6.69 weeks in mid-March. Lead times have been hovering around the 4.5-week mark since roughly mid-June.
Note: Demand, lead times and prices are based on the average data from manufacturers and steel service centers who participate in SMU market trends analysis surveys. Our demand and lead times do not predict prices but are leading indicators of overall market dynamics and potential pricing dynamics. Look to your mill rep for actual lead times and prices.


