

Market Data
August 6, 2023
SMU Steel Demand Index Edges Lower
Written by David Schollaert
Editor’s note: Steel Market Update is pleased to share this Premium content with Executive members. For information on upgrading to a Premium-level subscription, contact Lindsey Fox at lindsey@steelmarketupdate.com.
Steel Market Update’s Demand Index has been contracting for most of the last three months, according to the latest survey data. Despite a marginal improvement in response to mill price hikes in mid-June, apparent demand for flat-rolled steel in the US continues to show weakness.
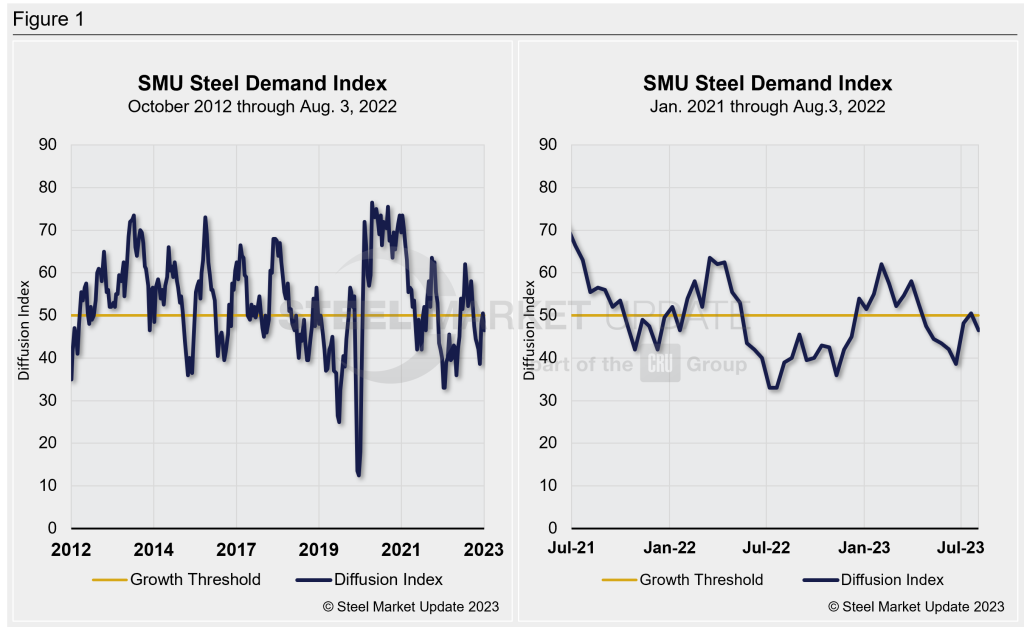
SMU’s Steel Demand Index now stands at 46. Down 4 points from a reading of 50.5 in mid/late July. The measure was also down 15.53 points from the recent high of 62 reached in February. It has now been mostly trending down since early April.
The index, which compares lead times and demand, is a diffusion index derived from the market surveys we conduct every two weeks. This index has historically preceded lead times, which is notable given that lead times are often seen as a leading indicator of steel price moves.
An index score higher than 50 indicates an increase in demand and a score below 50 suggests a decrease. Detailed side-by-side in Figure 1 are both the historical views and the latest Steel Demand Index.
Market talk about demand is mixed. Some suggest market indicators are sideways or down, and there are growing concerns about labor contract negotiations between the United Auto Workers (UAW) union and automaker Ford, General Motors, and Stellantis. Yet others have continued to note a strong summer, and expect August to maintain that trend.
SMU’s latest check of the market on Aug. 1 placed HRC at $810 per ton ($40.50 per cwt) on average FOB mill, east of the Rockies, down $20 per ton vs. the prior week. Hot band is now down $350 per ton since reaching the recent high of $1,160 per ton in mid-April.
There are still questions on whether low inventory levels and steady demand could provide some support to prices.
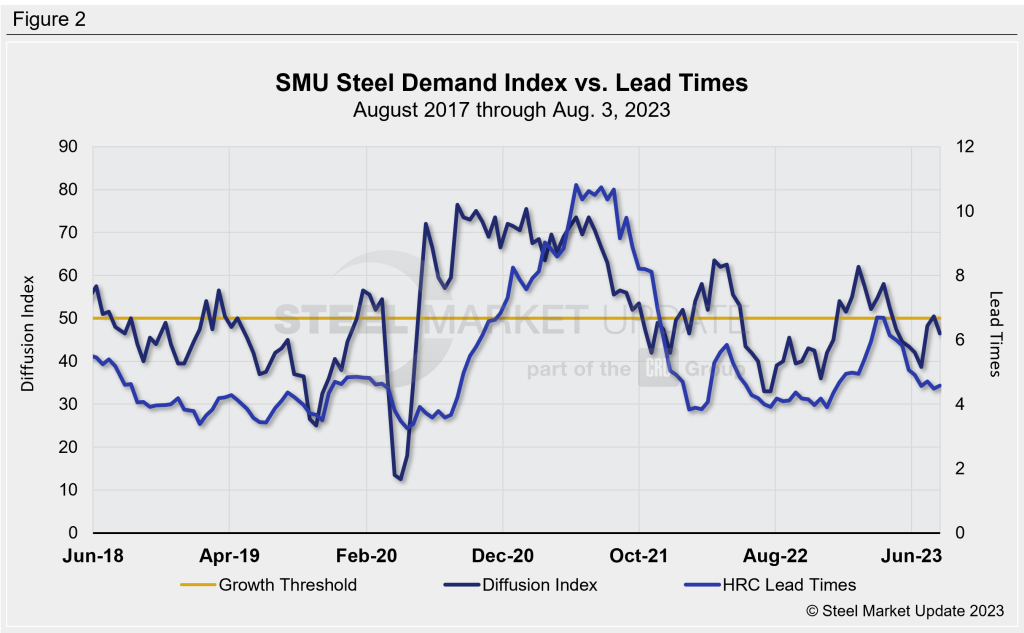
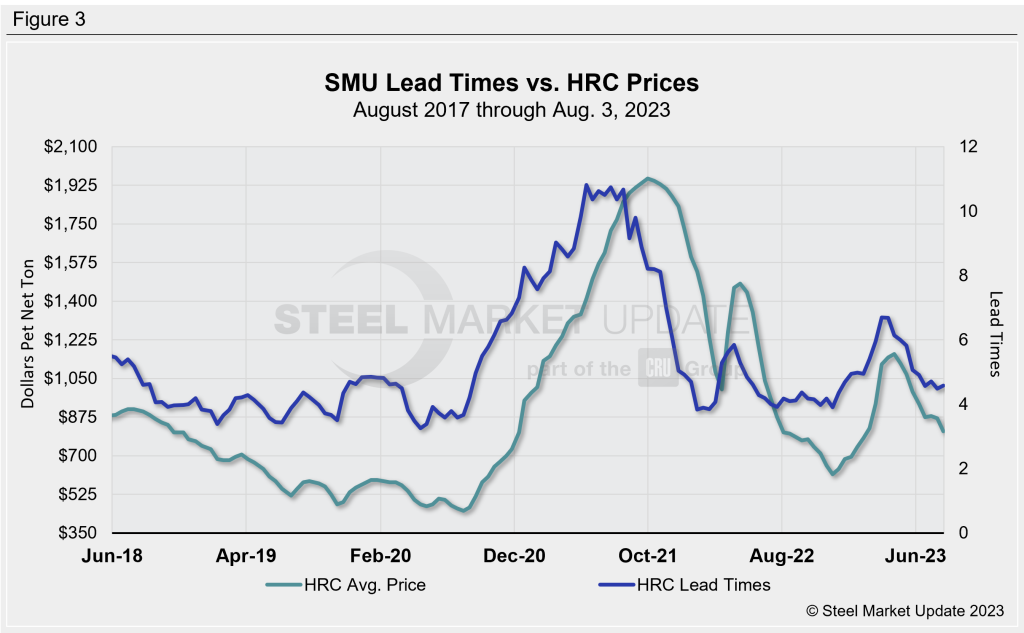
SMU’s demand diffusion index has, for nearly a decade, preceded moves in steel mill lead times. (Figure 2 shows the past five years.) Historically, SMU’s lead times have also been a leading indicator for flat-rolled steel prices, and HRC prices in particular. (Figure 3 features the past five years.)
But other indicators might be pointing to a holding pattern. Lead times are roughly sideways, according to our latest check of the market, and some anticipate August scrap prices to be sideways after repeated declines.
Our hot-rolled lead times average approximately 4.58 weeks, up marginally from 4.48 weeks in late July, but far from a recent high of 6.7 weeks in mid-March. Lead times have been hovering around the 4.5-week mark since roughly mid-June.
The takeaway: Mills tried to draw a line in the sand with price hikes in mid-June. That effort has failed to raise prices. The increases might have slowed the bleeding in sheet prices, but they did not reverse the downward trend. These readings, however, might still be indicative of summer seasonality, and thus the remainder of the third quarter will be closely watched.
Note: Demand, lead times and prices are based on the average data from manufacturers and steel service centers who participate in SMU market trends analysis surveys. Our demand and lead times do not predict prices but are leading indicators of overall market dynamics and potential pricing dynamics. Look to your mill rep for actual lead times and prices.


