Market Data
April 18, 2023
Service Center Shipments and Inventories Report for March
Written by Estelle Tran
Flat Rolled = 52.7 Shipping Days of Supply
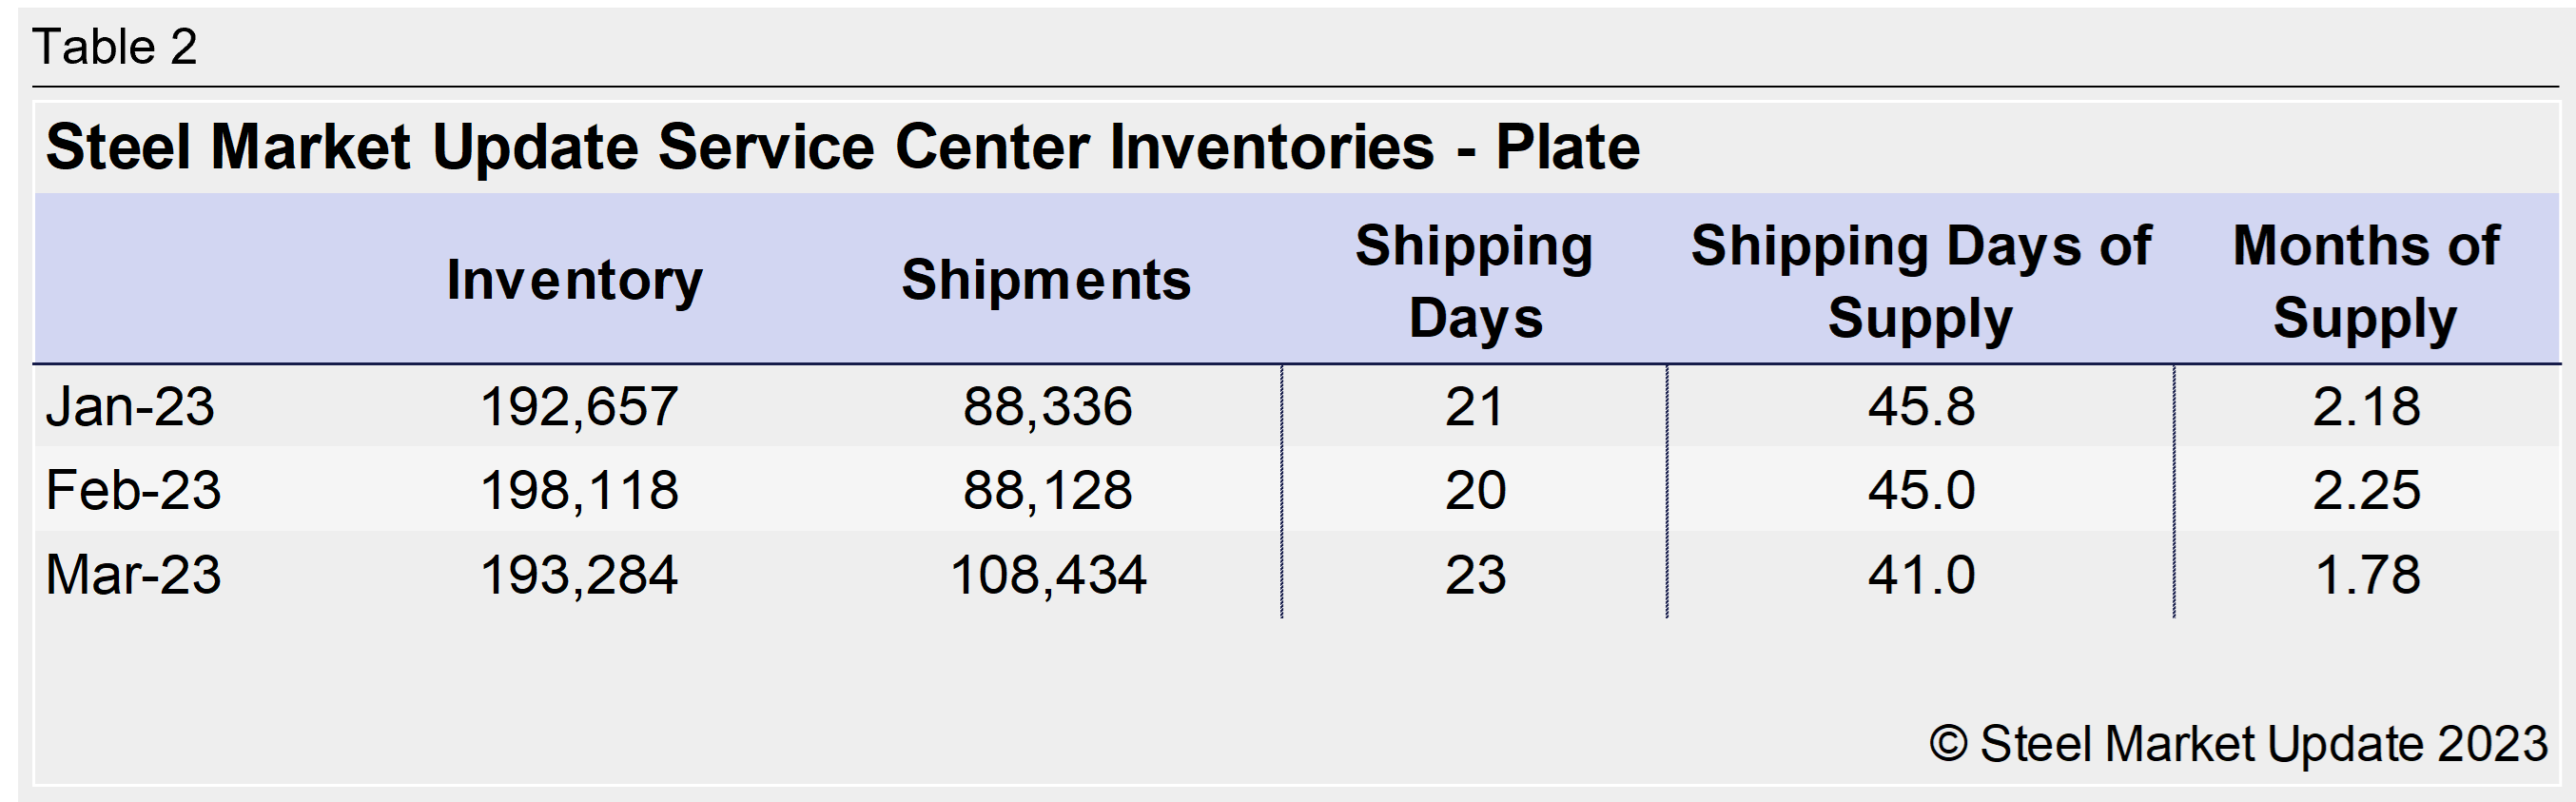
Plate = 41.0 Shipping Days of Supply
Flat Rolled
US service center flat-rolled steel inventories rose in March with a slowing daily shipping rate. At the end of March, service centers carried 52.7 shipping days of flat-rolled steel supply, according to SMU data, compared to 52.2 shipping days of supply on an adjusted basis at the end of February.
March had 23 shipping days, compared to February’s 20. The higher number of shipping days in March distorts the months of supply calculation. March inventory represented 2.29 months of supply, while service centers held 2.61 months of supply in February. The March 29th SMU survey found that 83% of service centers viewed their inventories to be in balance, up from 78% two weeks prior, and 13% saw their inventories as low or very low.
Inventories look to be in a surplus now, and the high level of material on order with a possible slowdown in manufacturing activity could bring flat-rolled steel supply into a greater surplus. The inventory balance relies on whether shipments maintain their strength. The daily shipping rate eased for two consecutive months. The March 29th SMU survey showed no manufacturers building inventory, which was down from 10% two weeks ago. The survey found 84% of manufacturers were planning to maintain inventories, up from 70% two weeks ago.
The amount of sheet steel on order in March was down slightly from in February. The amount of material on order was also down in March. Despite the slight drop in the amount of material on order, the total amount of sheet on order is the second highest it has been since late 2021. This could be indicative of long domestic mill lead times as well as imports. Market contacts have reported more openness to purchasing imports. The March 29th SMU survey found that 75% of service centers viewed new import offers to be competitive.
Market contacts have reported seeing some material rolled ahead of schedule, casting some doubt on the strength of mill order books. In the SMU survey published March 16th, HRC lead times reached 6.7 weeks, and then they plateaued at 6.68 weeks for the March 29th survey. The latest survey on April 12th showed HRC falling back to 6.14 weeks.
There is also the question if there has been enough ordered to account for demand considering the extended lead times and spring outages. If domestic lead times have peaked, we may start to see intake at service centers peak as well and new orders start to slow.


Plate
US service center plate inventories were already in a deficit at the end of January, and supply did not recover in February. At the end of February, service centers stocked 45 shipping days of supply of plate, according to SMU data. This is down from 45.8 shipping days of supply in January.
February inventories represented 2.25 months of supply, up from 2.18 in January.
Supply shortness is supporting US plate pricing similar to sheet, and steel mills recently announced $50-80-per-ton price increases for plate, following up on $60-per-ton price increases in February.
Lead times are similarly extending for plate. SMU reported the latest plate lead times at 5.67 weeks, up from five weeks in early February.
The latest SMU survey also found steel mills were less willing to negotiate lower prices for new orders compared to two weeks ago. Plate demand is steadier than sheet and less subject to the rapid demand fluctuations, though the amount of inventory on order has spiked.
At the end of February, service centers plate supply on order was up vs. January. The inventory deficit will continue to drive new orders for plate and should keep prices supported as well.
By Estelle Tran, estelle.tran@crugroup.com