Prices

August 4, 2022
HRC Futures: Scrap Expectations Send Futures to New Lows
Written by David Feldstein
Editor’s note: SMU Contributor David Feldstein is president of Rock Trading Advisors. Rock provides customers attached to the steel industry with commodity price risk management services and market intelligence. RTA is registered with the National Futures Association as a Commodity Trade Advisor. David has over 20 years of professional trading experience and has been active in the ferrous derivatives space since 2012.
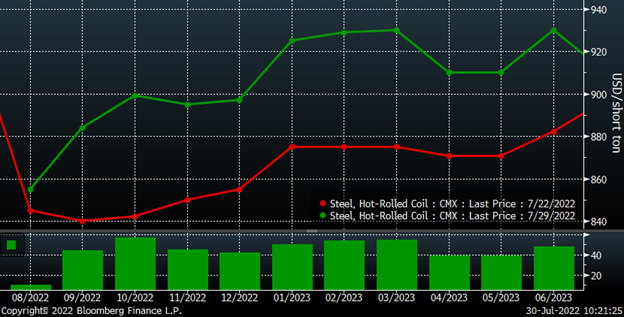
Last week, the HRC futures curve gained at least $40 from September through June 2023, marking its best week since March.
CME Hot Rolled Coil Futures Curve $/st

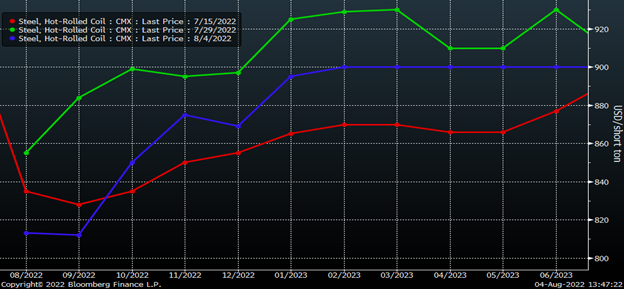
This chart shows the curve on July 15 (which was the most recent low), last Friday and today. So far this week, selling has come in targeting the front of the curve with the August and September futures falling to new lows, while the months after have held on to some of their gains. Buying in Q1 has remained steady in the face of the downside pressure on the front of the curve. The result has been a steepening of the curve with the January contract $80 above the September contract.
CME Hot Rolled Coil Futures Curve $/st

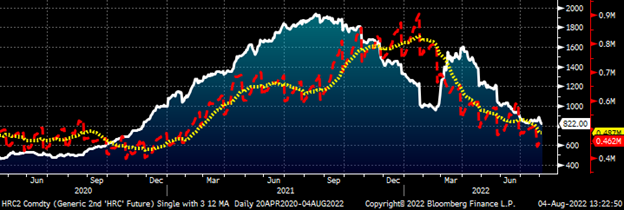
Open interest across the curve fell to 450,000 tons following July’s expiration last week. The red line below shows open interest with a 22-day moving average in yellow. Open interest is the number of outstanding futures contracts, or tons in this case.
Rolling 2nd Month CME Hot Rolled Coil Future $/st & Open Interest

Trading volume, shown in blue, has picked up over the past couple of weeks. The yellow line is a five-day moving average of daily trading volume across the curve, which has steadily risen to just above 23,000 today from a low of 9,000 on July 22.
August CME Hot Rolled Coil Future $/st w Aggregate Curve Volume & 5-Day Avg.

Scrap is expected to decline $50 month-on-month when settlements finalize next week. This might be the primary catalyst behind the downward pressure in the front of the HRC futures curve. This chart shows the front month busheling and Turkish scrap futures converging with the spread between the two contracts now at only $81.
Front Month CME Busheling $/lt (wh) & LME Turkish Scrap $/t (rd) Futures

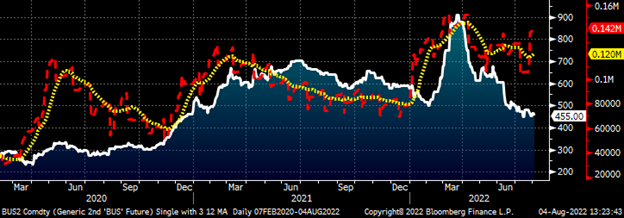
There has been a significant increase in trading volume across the busheling futures over the past two weeks as well. This has resulted in a noticeable jump in open interest in the busheling contract to 142,000 tons, its highest level since April.
Rolling 2nd Month CME Busheling Future $/lt & Open Interest

Disclaimer: The content of this article is for informational purposes only. The views in this article do not represent financial services or advice. Any opinion expressed by Feldstein should not be treated as a specific inducement to make a particular investment or follow a particular strategy, but only as an expression of his opinion. Views and forecasts expressed are as of date indicated, are subject to change without notice, may not come to be and do not represent a recommendation or offer of any particular security, strategy or investment. Strategies mentioned may not be suitable for you. You must make an independent decision regarding investments or strategies mentioned in this article. It is recommended you consider your own particular circumstances and seek the advice from a financial professional before taking action in financial markets.
By David Feldstein, Rock Trading Advisors


