

Market Data

April 18, 2022
Energy Market Analysis through April
Written by Brett Linton
The Energy Information Administration’s April Short-Term Energy Outlook (STEO) continues to remain subject to a high level of uncertainty due to Russia’s invasion of Ukraine. Regarding price forecasts, the EIA continues to warn that “actual outcomes will be dependent on the degree to which existing sanctions are imposed on Russia, any potential future sanctions, and independent corporate actions affect Russia’s oil production or the sale of Russia’s oil in the global market.”
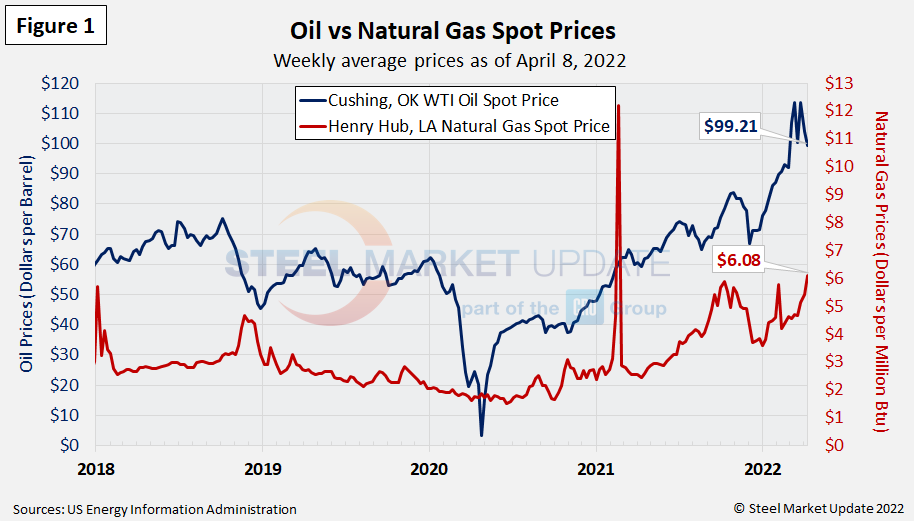
Spot Prices
The spot market price for West Texas Intermediate (WTI) was at $99.21 per barrel as of April 8 (Figure 1), the first week below $100 since Feb. 25. Since Steel Market Update’s previous energy update, spot prices reached a new high of $113.69/b on March 25, the highest weekly level since Aug. 2008. The EIA expects spot prices to average $108/b in the second quarter 2022, $102/b in the second half of this year, and $93/b in 2023 (again emphasizing these forecasts are highly uncertain).
Natural gas prices had eased through mid March, but are now moving upwards again. The spot price as of April 8 was $6.08 per MMBTU (Million British Thermal Units), the highest level seen since March 2014 (we are excluding the high spot-prices seen in Feb. 2021 due to winter storms and supply scarcity). EIA expects natural gas prices to average $5.68/MMBTU in the second quarter, $5.23/MMBTU for 2022 in total, and $4.01/MMBtU for 2023.
Rig Counts
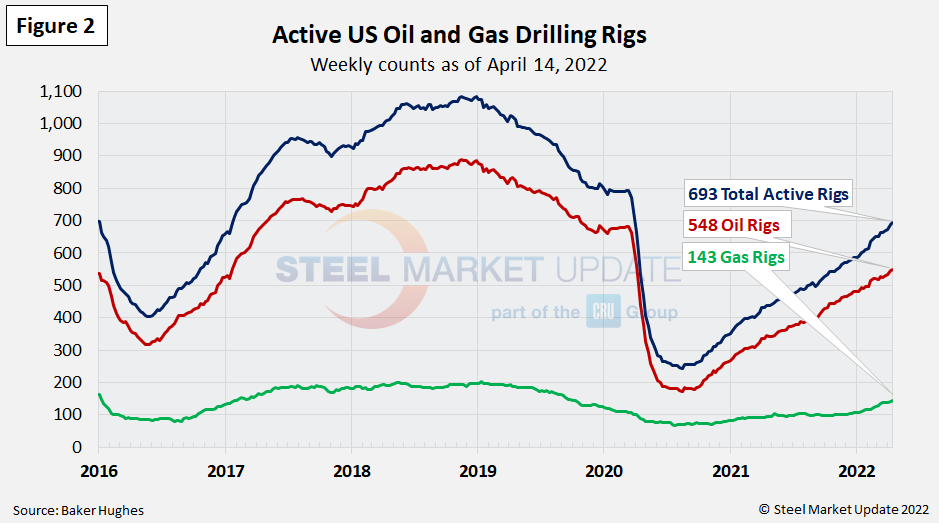
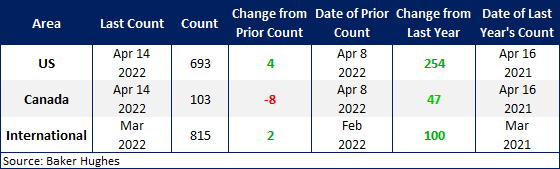
The number of active US oil and gas drill rigs continues to slowly recover from the mid-2020 low. The latest count was 693 active drill rigs as of the end of last week, comprised of 548 oil rigs, 143 gas rigs, and 2 miscellaneous rigs, according to Baker Hughes (Figure 2). Active drill rigs are still down 13% from the 793 count in March 2020, just prior to the coronavirus shutdowns. EIA expects rig counts to increase into 2022 as oil production rises in the US. The table below compares the current US, Canadian and international rig counts to historical levels.
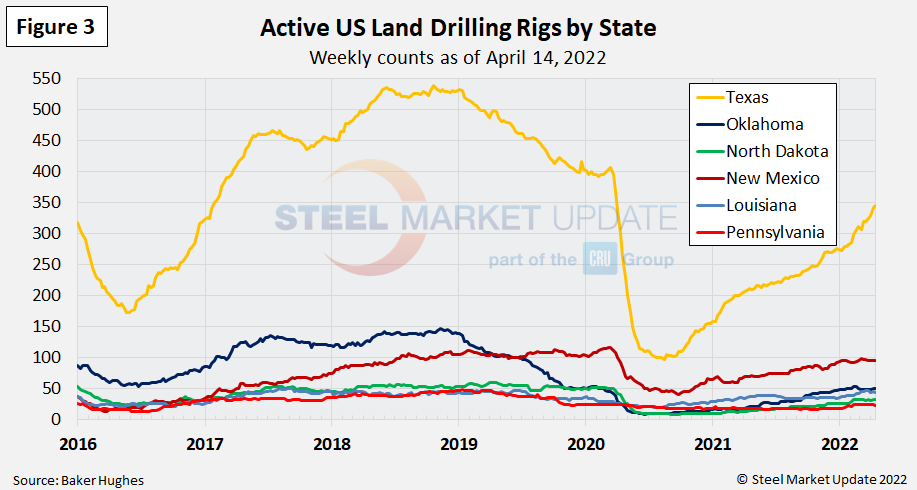
US oil and gas production are heavily concentrated in Texas, Oklahoma, North Dakota and New Mexico. As of April 14, production is steadily increasing, but still down as much as 35% compared to pre-COVID levels. The most active state is Texas with 346 rigs in operation, the highest level seen since March 2020. Recall that Texas rigs had plummeted 76% back in 2020, falling from 407 in April to 97 rigs in Aug. (Figure 3).
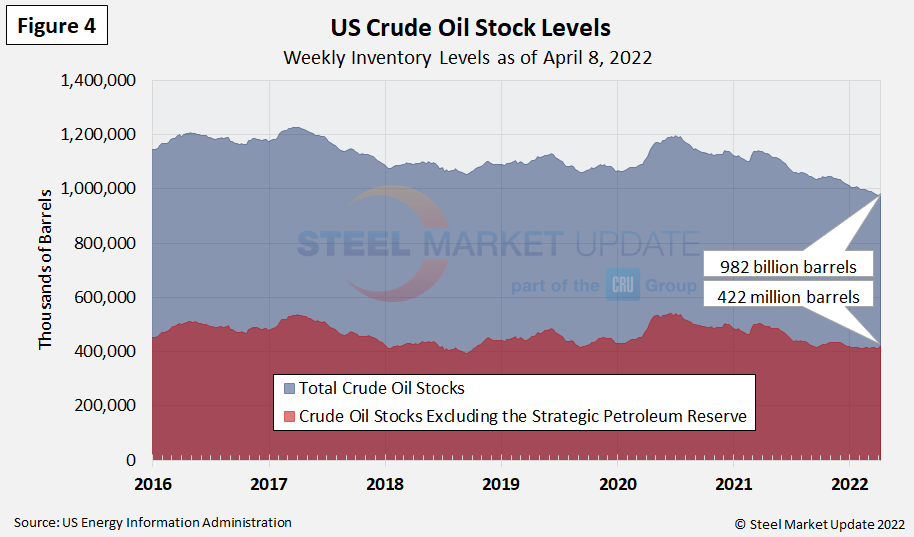
Stock Levels
US total crude oil stocks continue to decline from the mid-2020 high, falling to a 14-year low of 977 million barrels on April 1. Since then stock levels have increased slightly to 982 million barrels, compared to 1.129 billion barrels one year prior (Figure 4).
Trends in energy prices and rig counts are a predictor of demand for oil country tubular goods (OCTG), line pipe and other steel products.
By Brett Linton, Brett@SteelMarketUpdate.com


