Prices

April 7, 2022
February Steel Exports Rise to 4-Month High, 12MMA at 3-Year High
Written by Brett Linton
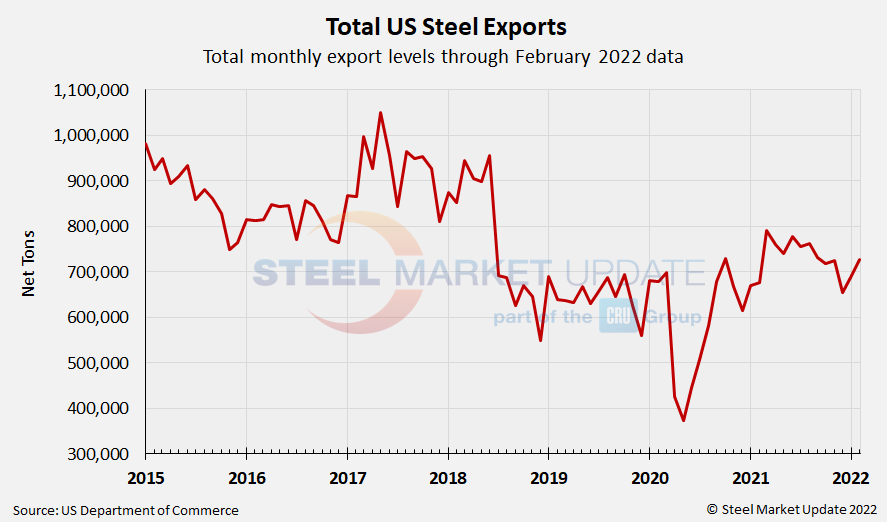
US steel exports increased 5% in February to 727,000 net tons, following a 6% rise in January, according to the latest US Department of Commerce data. The 12-month moving average through February has now reached a 3-year high. February exports are 7% higher than levels seen one year ago.
As shown in the graph below, February exports have risen to a four-month high. Nearly one year ago, we saw a high of 790,000 tons in March 2021, the highest monthly export level in the last three years. Recall exports had fallen to a 24-year low in May 2020 to 374,000 tons.
Of our six monitored product groups in February, four increased month-over-month.
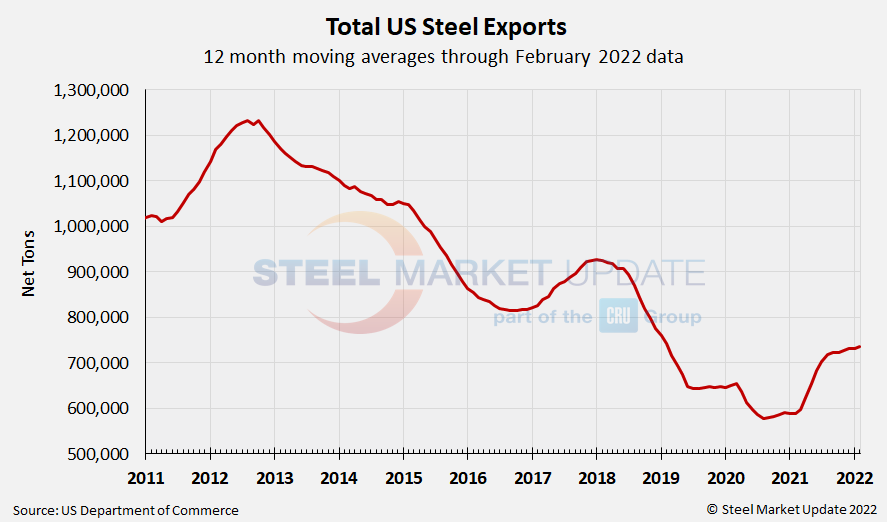
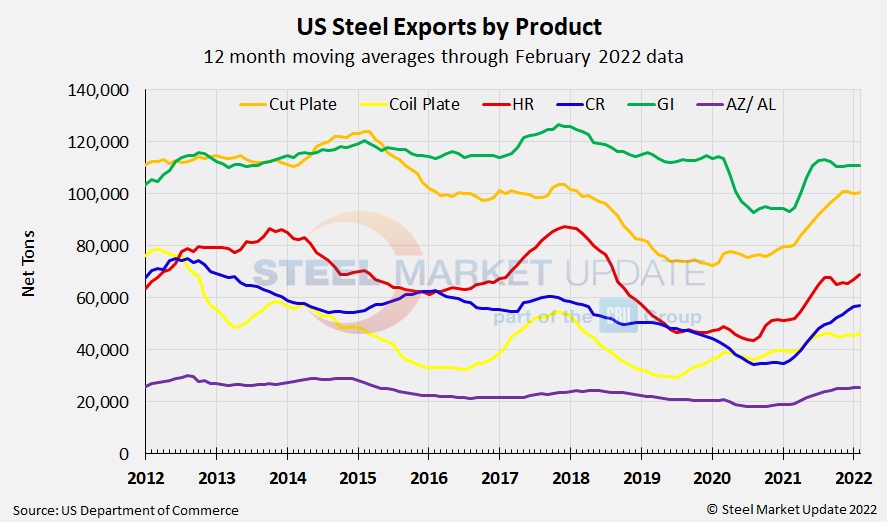
On a rolling 12-month average, February exports are now at a 36-month high of 736,000 tons (recall August 2020’s record low 12MMA of 577,000 tons). Total exports averaged 731,000 tons per month in 2021, compared to 591,000 tons in 2020, 648,000 tons in 2019, and 775,000 tons in 2018.
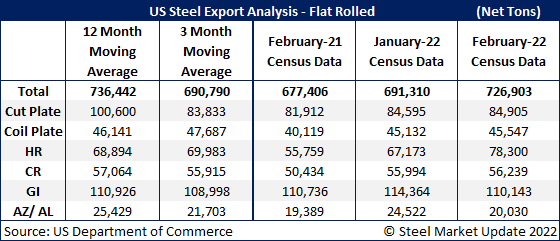
Total February exports are 5% above the three-month moving average (average of December 2020 through February 2021), and 1% below the 12-month moving average (average of March 2020 through February 2021). Here is a detailed breakdown by product:
Cut-to-length plate exports were just 310 tons above January at 84,905 tons, up 4% compared to one year ago.
Exports of coiled plate were 45,547 tons in February, up 1% from the prior month and up 14% from levels this time last year.
February hot rolled steel exports were up 17% from January at 78,300 tons, up 40% from one year prior.
Exports of cold rolled products were 56,239 tons in February, 246 tons higher than January and up 12% from the same time last year.
Galvanized exports decreased 4% month over month to 110,143 tons. Compared to levels one year ago, February was down by 1%.
Exports of all other metallic-coated products were 20,030 tons, down 18% from January, but up 3% year-over-year.
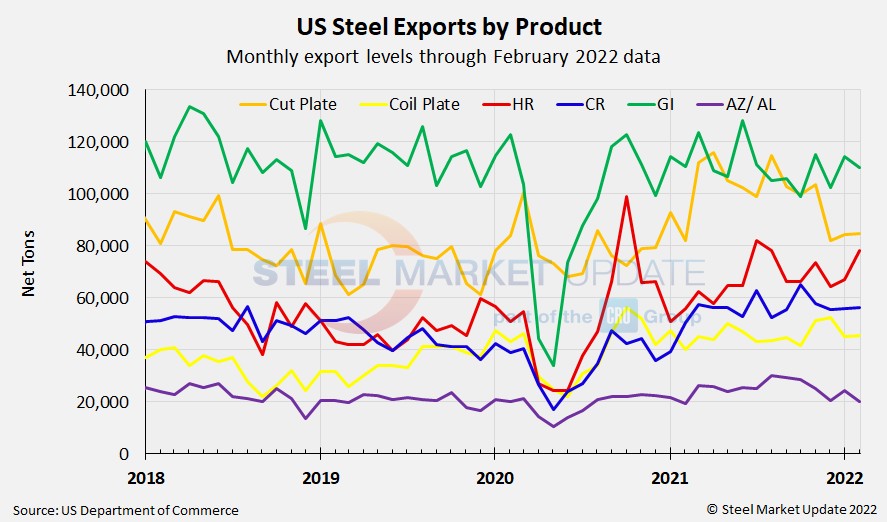
The graphics below show US exports by product, both monthly levels and as a 12MMA.
We have an interactive graphing tool available on our website here where readers can further investigate historical export data in total and by product. If you need assistance logging into or navigating the website, contact us at Info@SteelMarketUpdate.com.
By Brett Linton, Brett@SteelMarketUpdate.com


