

Market Data

August 12, 2021
SMU Energy Market Analysis through August
Written by Brett Linton
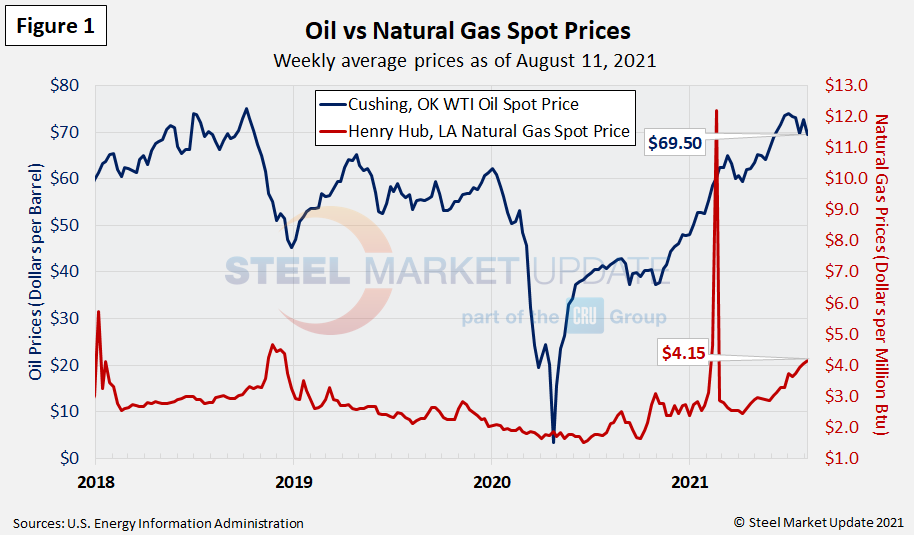
The Energy Information Administration’s August Short-Term Energy Outlook remains subject to heightened levels of uncertainty related to the ongoing economic recovery from the COVID-19 pandemic. That big caveat aside, the increase in economic activity continues to contribute to rising energy use. EIA anticipates a mostly balanced global oil market for the remainder of 2021. Crude oil prices are forecast to remain steady through the remainder of the year, while natural gas prices are expected to slightly decline. The EIA expects oil production to increase in the coming months, eventually outpacing consumption, resulting in steady spot prices averaging $72 per barrel from August through November 2021 and averaging $66 in 2022. EIA forecasts natural gas prices to average $3.42 per MMBtu in 2021, declining to a $3.08 average in 2022.
Spot Prices
The spot market price for West Texas Intermediate (WTI) has declined from July’s peak, now at $69.50 per barrel as of Aug. 11. The July 2, 2021, weekly average of $74.07 was is the highest weekly oil spot price average since October 2018, a 33-month high. Natural gas prices at the Henry Hub in Oklahoma continue to rise, now at $4.15 per MMBTU (million British Thermal Units) as of Aug. 11. Excluding the February 2021 surge (when winter storms impacted much of the nation and the scarcity of natural gas and rising demand drove spot prices through the roof), this is the highest weekly oil spot price average since Dec. 14, 2018, when it was $4.38 per MMBTU. Figure 1 shows the weekly average spot prices for each product.
Rig Counts
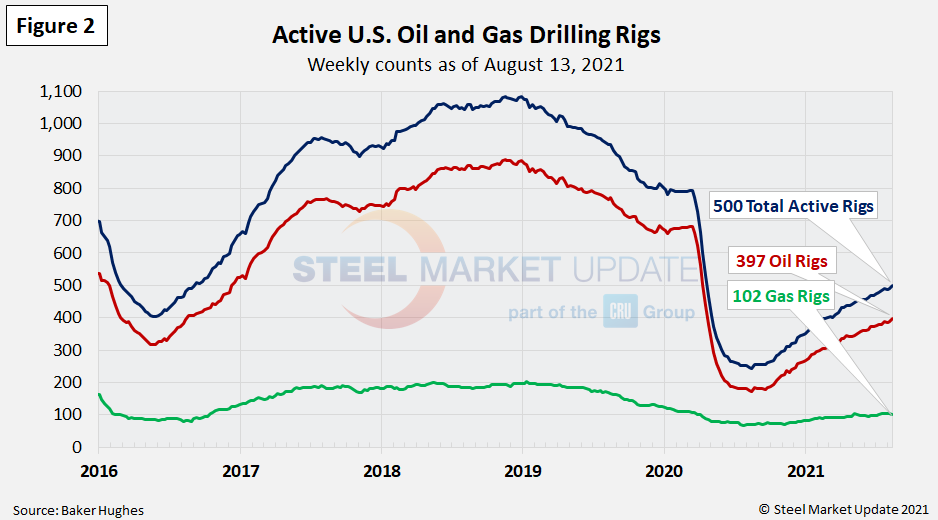
The number of active U.S. oil and gas drill rigs continues to recover since the mid-2020 low. The count was 500 active drill rigs as of the end of last week. That total is comprised of 397 oil rigs and 102 gas rigs, according to the latest data from Baker Hughes (Figure 2). While up over recent months, active drill rigs are still down 37% from 793 rigs in March 2020, just prior to the coronavirus shutdowns. The table below compares the current U.S., Canadian and international rig counts to historical levels.
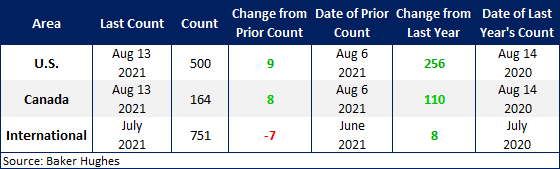
U.S. oil and gas production are heavily concentrated in Texas, Oklahoma, North Dakota and New Mexico, which have seen declines of 35-65% since March of last year. The most active state, Texas, now has 231 active rigs in operation, the highest level seen since April 17, 2020. Texas rigs had plummeted from 407 in March 2020 to 97 rigs in August 2020 (Figure 3).
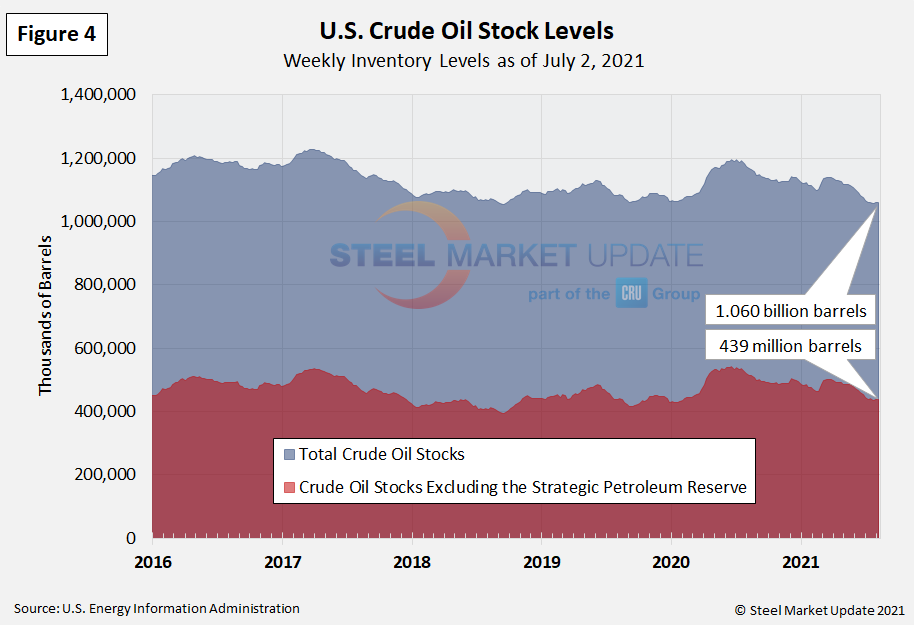
Stock Levels
U.S. total crude oil stocks in 2020 surged from mid-March through July, but they have steadily declined since then. The latest level is down yet again compared to the previous Energy Update; 1.060 billion barrels as of Aug. 11, down from 1.168 billion barrels at the same time last year (Figure 4).
Trends in energy prices and rig counts are a predictor of demand for oil country tubular goods (OCTG), line pipe and other steel products.
By Brett Linton, Brett@SteelMarketUpdate.com


